South African vs Yaqui Seniors Poverty Over the Age of 75
COMPARE
South African
Yaqui
Seniors Poverty Over the Age of 75
Seniors Poverty Over the Age of 75 Comparison
South Africans
Yaqui
11.7%
SENIORS POVERTY OVER THE AGE OF 75
89.3/ 100
METRIC RATING
109th/ 347
METRIC RANK
12.5%
SENIORS POVERTY OVER THE AGE OF 75
25.9/ 100
METRIC RATING
187th/ 347
METRIC RANK
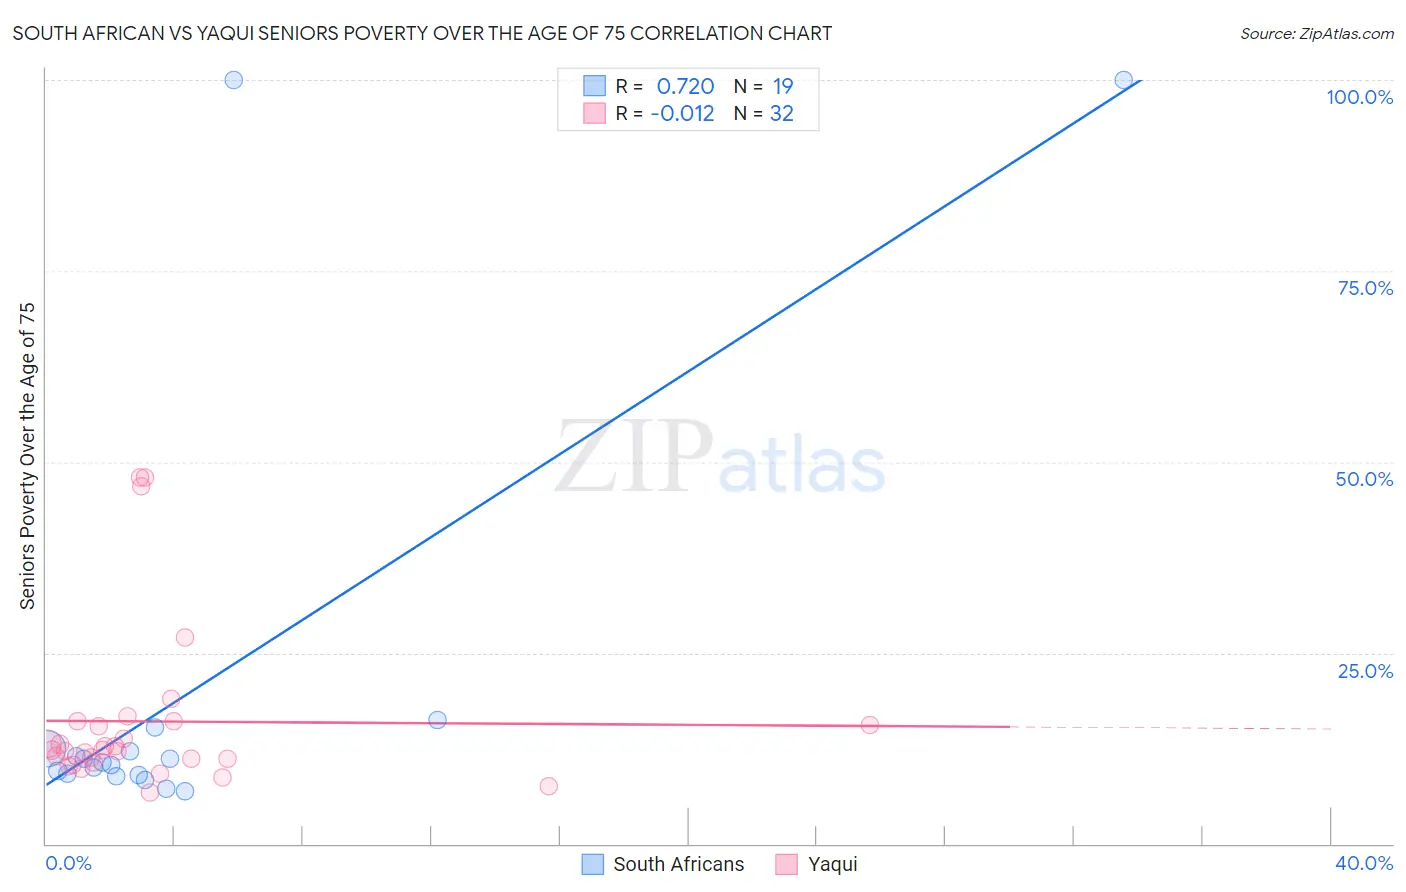
South African vs Yaqui Seniors Poverty Over the Age of 75 Correlation Chart
The statistical analysis conducted on geographies consisting of 181,308,648 people shows a strong positive correlation between the proportion of South Africans and poverty level among seniors over the age of 75 in the United States with a correlation coefficient (R) of 0.720 and weighted average of 11.7%. Similarly, the statistical analysis conducted on geographies consisting of 107,262,070 people shows no correlation between the proportion of Yaqui and poverty level among seniors over the age of 75 in the United States with a correlation coefficient (R) of -0.012 and weighted average of 12.5%, a difference of 6.8%.
Seniors Poverty Over the Age of 75 Correlation Summary
| Measurement | South African | Yaqui |
| Minimum | 6.9% | 6.8% |
| Maximum | 100.0% | 48.0% |
| Range | 93.1% | 41.2% |
| Mean | 20.0% | 16.0% |
| Median | 10.6% | 12.3% |
| Interquartile 25% (IQ1) | 9.0% | 10.9% |
| Interquartile 75% (IQ3) | 12.5% | 15.8% |
| Interquartile Range (IQR) | 3.5% | 4.9% |
| Standard Deviation (Sample) | 28.3% | 11.0% |
| Standard Deviation (Population) | 27.5% | 10.8% |
Similar Demographics by Seniors Poverty Over the Age of 75
Demographics Similar to South Africans by Seniors Poverty Over the Age of 75
In terms of seniors poverty over the age of 75, the demographic groups most similar to South Africans are Turkish (11.7%, a difference of 0.0%), Immigrants from Oceania (11.7%, a difference of 0.020%), Russian (11.6%, a difference of 0.13%), Immigrants from Jordan (11.7%, a difference of 0.15%), and Burmese (11.7%, a difference of 0.15%).
| Demographics | Rating | Rank | Seniors Poverty Over the Age of 75 |
| Guamanians/Chamorros | 90.6 /100 | #102 | Exceptional 11.6% |
| Immigrants | Kuwait | 90.5 /100 | #103 | Exceptional 11.6% |
| Immigrants | Singapore | 90.3 /100 | #104 | Exceptional 11.6% |
| Chickasaw | 90.2 /100 | #105 | Exceptional 11.6% |
| Russians | 89.9 /100 | #106 | Excellent 11.6% |
| Immigrants | Oceania | 89.4 /100 | #107 | Excellent 11.7% |
| Turks | 89.4 /100 | #108 | Excellent 11.7% |
| South Africans | 89.3 /100 | #109 | Excellent 11.7% |
| Immigrants | Jordan | 88.7 /100 | #110 | Excellent 11.7% |
| Burmese | 88.7 /100 | #111 | Excellent 11.7% |
| Immigrants | Bolivia | 88.4 /100 | #112 | Excellent 11.7% |
| Immigrants | Czechoslovakia | 87.0 /100 | #113 | Excellent 11.7% |
| Ukrainians | 86.9 /100 | #114 | Excellent 11.7% |
| New Zealanders | 86.3 /100 | #115 | Excellent 11.7% |
| Iraqis | 86.3 /100 | #116 | Excellent 11.7% |
Demographics Similar to Yaqui by Seniors Poverty Over the Age of 75
In terms of seniors poverty over the age of 75, the demographic groups most similar to Yaqui are Immigrants from Northern Africa (12.5%, a difference of 0.070%), Immigrants from Indonesia (12.5%, a difference of 0.15%), Immigrants from Congo (12.5%, a difference of 0.21%), Liberian (12.5%, a difference of 0.29%), and Sri Lankan (12.4%, a difference of 0.63%).
| Demographics | Rating | Rank | Seniors Poverty Over the Age of 75 |
| Immigrants | South Eastern Asia | 44.3 /100 | #180 | Average 12.2% |
| Immigrants | Australia | 44.2 /100 | #181 | Average 12.2% |
| German Russians | 41.4 /100 | #182 | Average 12.3% |
| Laotians | 38.2 /100 | #183 | Fair 12.3% |
| Kiowa | 36.0 /100 | #184 | Fair 12.3% |
| Immigrants | Malaysia | 35.8 /100 | #185 | Fair 12.3% |
| Sri Lankans | 32.3 /100 | #186 | Fair 12.4% |
| Yaqui | 25.9 /100 | #187 | Fair 12.5% |
| Immigrants | Northern Africa | 25.2 /100 | #188 | Fair 12.5% |
| Immigrants | Indonesia | 24.4 /100 | #189 | Fair 12.5% |
| Immigrants | Congo | 23.9 /100 | #190 | Fair 12.5% |
| Liberians | 23.2 /100 | #191 | Fair 12.5% |
| Choctaw | 20.2 /100 | #192 | Fair 12.5% |
| Taiwanese | 17.8 /100 | #193 | Poor 12.6% |
| Alsatians | 17.7 /100 | #194 | Poor 12.6% |