Somali vs Immigrants from Eastern Europe Unemployment Among Ages 16 to 19 years
COMPARE
Somali
Immigrants from Eastern Europe
Unemployment Among Ages 16 to 19 years
Unemployment Among Ages 16 to 19 years Comparison
Somalis
Immigrants from Eastern Europe
15.7%
UNEMPLOYMENT AMONG AGES 16 TO 19 YEARS
100.0/ 100
METRIC RATING
17th/ 347
METRIC RANK
17.8%
UNEMPLOYMENT AMONG AGES 16 TO 19 YEARS
23.6/ 100
METRIC RATING
203rd/ 347
METRIC RANK
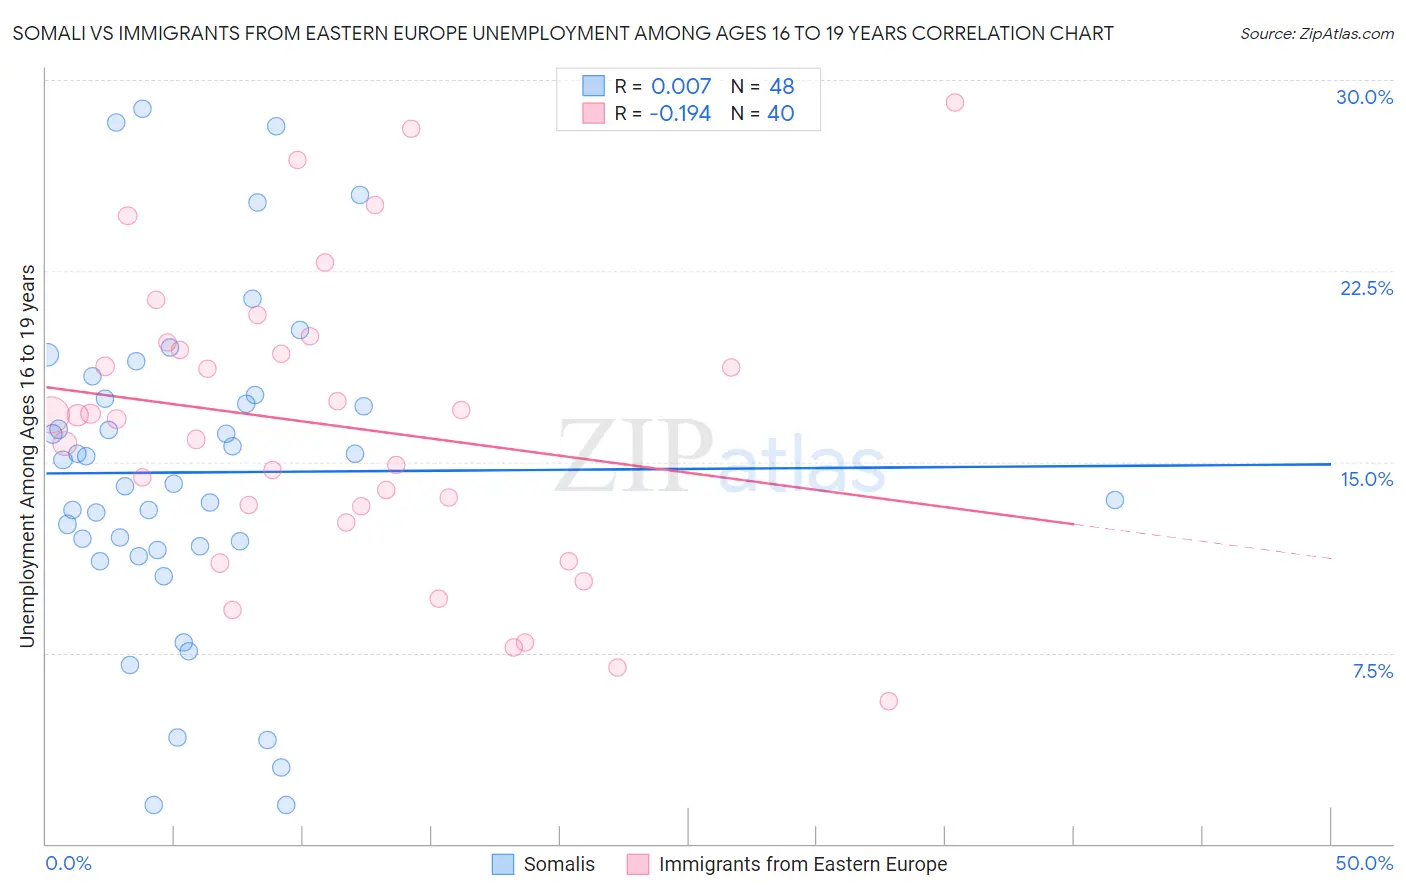
Somali vs Immigrants from Eastern Europe Unemployment Among Ages 16 to 19 years Correlation Chart
The statistical analysis conducted on geographies consisting of 98,133,390 people shows no correlation between the proportion of Somalis and unemployment rate among population between the ages 16 and 19 in the United States with a correlation coefficient (R) of 0.007 and weighted average of 15.7%. Similarly, the statistical analysis conducted on geographies consisting of 442,703,525 people shows a poor negative correlation between the proportion of Immigrants from Eastern Europe and unemployment rate among population between the ages 16 and 19 in the United States with a correlation coefficient (R) of -0.194 and weighted average of 17.8%, a difference of 13.5%.
Unemployment Among Ages 16 to 19 years Correlation Summary
| Measurement | Somali | Immigrants from Eastern Europe |
| Minimum | 1.5% | 5.6% |
| Maximum | 28.9% | 29.1% |
| Range | 27.4% | 23.5% |
| Mean | 14.6% | 16.4% |
| Median | 14.6% | 16.7% |
| Interquartile 25% (IQ1) | 11.6% | 12.9% |
| Interquartile 75% (IQ3) | 17.6% | 19.6% |
| Interquartile Range (IQR) | 5.9% | 6.6% |
| Standard Deviation (Sample) | 6.4% | 5.8% |
| Standard Deviation (Population) | 6.4% | 5.7% |
Similar Demographics by Unemployment Among Ages 16 to 19 years
Demographics Similar to Somalis by Unemployment Among Ages 16 to 19 years
In terms of unemployment among ages 16 to 19 years, the demographic groups most similar to Somalis are German (15.7%, a difference of 0.21%), Thai (15.7%, a difference of 0.24%), Swiss (15.8%, a difference of 0.35%), Sudanese (15.8%, a difference of 0.44%), and Yugoslavian (15.6%, a difference of 0.50%).
| Demographics | Rating | Rank | Unemployment Among Ages 16 to 19 years |
| Zimbabweans | 100.0 /100 | #10 | Exceptional 15.4% |
| Indonesians | 100.0 /100 | #11 | Exceptional 15.5% |
| Taiwanese | 100.0 /100 | #12 | Exceptional 15.5% |
| Immigrants | Burma/Myanmar | 100.0 /100 | #13 | Exceptional 15.6% |
| Immigrants | Zaire | 100.0 /100 | #14 | Exceptional 15.6% |
| Yugoslavians | 100.0 /100 | #15 | Exceptional 15.6% |
| Germans | 100.0 /100 | #16 | Exceptional 15.7% |
| Somalis | 100.0 /100 | #17 | Exceptional 15.7% |
| Thais | 100.0 /100 | #18 | Exceptional 15.7% |
| Swiss | 100.0 /100 | #19 | Exceptional 15.8% |
| Sudanese | 100.0 /100 | #20 | Exceptional 15.8% |
| Immigrants | Taiwan | 100.0 /100 | #21 | Exceptional 15.8% |
| Finns | 100.0 /100 | #22 | Exceptional 15.9% |
| Belgians | 100.0 /100 | #23 | Exceptional 15.9% |
| Tongans | 100.0 /100 | #24 | Exceptional 15.9% |
Demographics Similar to Immigrants from Eastern Europe by Unemployment Among Ages 16 to 19 years
In terms of unemployment among ages 16 to 19 years, the demographic groups most similar to Immigrants from Eastern Europe are Nonimmigrants (17.9%, a difference of 0.18%), Assyrian/Chaldean/Syriac (17.9%, a difference of 0.19%), Immigrants from Portugal (17.8%, a difference of 0.22%), Immigrants from Ethiopia (17.8%, a difference of 0.23%), and Immigrants from Fiji (17.8%, a difference of 0.25%).
| Demographics | Rating | Rank | Unemployment Among Ages 16 to 19 years |
| Alaskan Athabascans | 34.1 /100 | #196 | Fair 17.7% |
| Immigrants | Czechoslovakia | 29.8 /100 | #197 | Fair 17.8% |
| Ethiopians | 29.6 /100 | #198 | Fair 17.8% |
| Immigrants | Ireland | 28.5 /100 | #199 | Fair 17.8% |
| Immigrants | Fiji | 27.7 /100 | #200 | Fair 17.8% |
| Immigrants | Ethiopia | 27.4 /100 | #201 | Fair 17.8% |
| Immigrants | Portugal | 27.2 /100 | #202 | Fair 17.8% |
| Immigrants | Eastern Europe | 23.6 /100 | #203 | Fair 17.8% |
| Immigrants | Nonimmigrants | 20.9 /100 | #204 | Fair 17.9% |
| Assyrians/Chaldeans/Syriacs | 20.8 /100 | #205 | Fair 17.9% |
| Immigrants | Southern Europe | 18.9 /100 | #206 | Poor 17.9% |
| Liberians | 18.6 /100 | #207 | Poor 17.9% |
| Hawaiians | 16.8 /100 | #208 | Poor 17.9% |
| Cherokee | 15.7 /100 | #209 | Poor 17.9% |
| Carpatho Rusyns | 15.6 /100 | #210 | Poor 17.9% |