Slovak vs Scotch-Irish Seniors Poverty Over the Age of 75
COMPARE
Slovak
Scotch-Irish
Seniors Poverty Over the Age of 75
Seniors Poverty Over the Age of 75 Comparison
Slovaks
Scotch-Irish
10.5%
SENIORS POVERTY OVER THE AGE OF 75
99.9/ 100
METRIC RATING
17th/ 347
METRIC RANK
10.8%
SENIORS POVERTY OVER THE AGE OF 75
99.6/ 100
METRIC RATING
36th/ 347
METRIC RANK
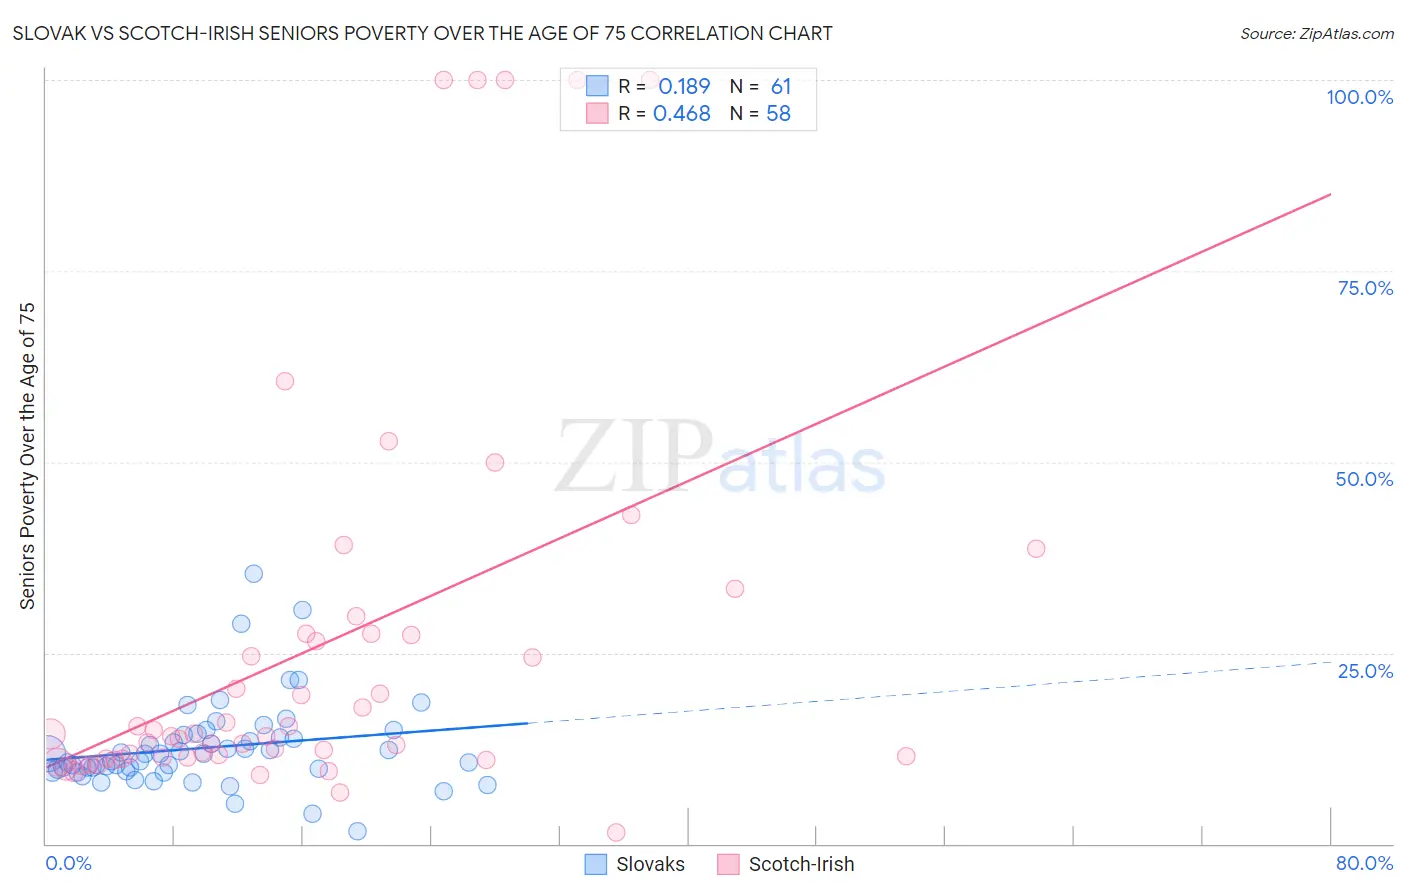
Slovak vs Scotch-Irish Seniors Poverty Over the Age of 75 Correlation Chart
The statistical analysis conducted on geographies consisting of 392,230,662 people shows a poor positive correlation between the proportion of Slovaks and poverty level among seniors over the age of 75 in the United States with a correlation coefficient (R) of 0.189 and weighted average of 10.5%. Similarly, the statistical analysis conducted on geographies consisting of 534,526,562 people shows a moderate positive correlation between the proportion of Scotch-Irish and poverty level among seniors over the age of 75 in the United States with a correlation coefficient (R) of 0.468 and weighted average of 10.8%, a difference of 2.5%.
Seniors Poverty Over the Age of 75 Correlation Summary
| Measurement | Slovak | Scotch-Irish |
| Minimum | 1.7% | 1.4% |
| Maximum | 35.3% | 100.0% |
| Range | 33.7% | 98.6% |
| Mean | 12.6% | 25.7% |
| Median | 11.8% | 14.2% |
| Interquartile 25% (IQ1) | 9.6% | 11.2% |
| Interquartile 75% (IQ3) | 14.1% | 27.4% |
| Interquartile Range (IQR) | 4.4% | 16.2% |
| Standard Deviation (Sample) | 5.7% | 25.9% |
| Standard Deviation (Population) | 5.7% | 25.6% |
Demographics Similar to Slovaks and Scotch-Irish by Seniors Poverty Over the Age of 75
In terms of seniors poverty over the age of 75, the demographic groups most similar to Slovaks are Welsh (10.5%, a difference of 0.010%), Immigrants from Scotland (10.5%, a difference of 0.040%), Czech (10.5%, a difference of 0.060%), Slovene (10.6%, a difference of 0.10%), and Dutch (10.5%, a difference of 0.21%). Similarly, the demographic groups most similar to Scotch-Irish are Luxembourger (10.8%, a difference of 0.050%), Italian (10.8%, a difference of 0.43%), Puget Sound Salish (10.8%, a difference of 0.49%), British (10.7%, a difference of 0.54%), and Marshallese (10.7%, a difference of 0.68%).
| Demographics | Rating | Rank | Seniors Poverty Over the Age of 75 |
| Dutch | 99.9 /100 | #16 | Exceptional 10.5% |
| Slovaks | 99.9 /100 | #17 | Exceptional 10.5% |
| Welsh | 99.9 /100 | #18 | Exceptional 10.5% |
| Immigrants | Scotland | 99.9 /100 | #19 | Exceptional 10.5% |
| Czechs | 99.9 /100 | #20 | Exceptional 10.5% |
| Slovenes | 99.9 /100 | #21 | Exceptional 10.6% |
| Bhutanese | 99.8 /100 | #22 | Exceptional 10.6% |
| Lithuanians | 99.8 /100 | #23 | Exceptional 10.6% |
| Poles | 99.8 /100 | #24 | Exceptional 10.6% |
| Menominee | 99.8 /100 | #25 | Exceptional 10.6% |
| Bulgarians | 99.8 /100 | #26 | Exceptional 10.7% |
| Northern Europeans | 99.8 /100 | #27 | Exceptional 10.7% |
| Irish | 99.8 /100 | #28 | Exceptional 10.7% |
| Assyrians/Chaldeans/Syriacs | 99.8 /100 | #29 | Exceptional 10.7% |
| Swiss | 99.7 /100 | #30 | Exceptional 10.7% |
| Marshallese | 99.7 /100 | #31 | Exceptional 10.7% |
| British | 99.7 /100 | #32 | Exceptional 10.7% |
| Puget Sound Salish | 99.7 /100 | #33 | Exceptional 10.8% |
| Italians | 99.7 /100 | #34 | Exceptional 10.8% |
| Luxembourgers | 99.6 /100 | #35 | Exceptional 10.8% |
| Scotch-Irish | 99.6 /100 | #36 | Exceptional 10.8% |