Tsimshian vs Italian Seniors Poverty Over the Age of 75
COMPARE
Tsimshian
Italian
Seniors Poverty Over the Age of 75
Seniors Poverty Over the Age of 75 Comparison
Tsimshian
Italians
16.1%
SENIORS POVERTY OVER THE AGE OF 75
0.0/ 100
METRIC RATING
314th/ 347
METRIC RANK
10.8%
SENIORS POVERTY OVER THE AGE OF 75
99.7/ 100
METRIC RATING
34th/ 347
METRIC RANK
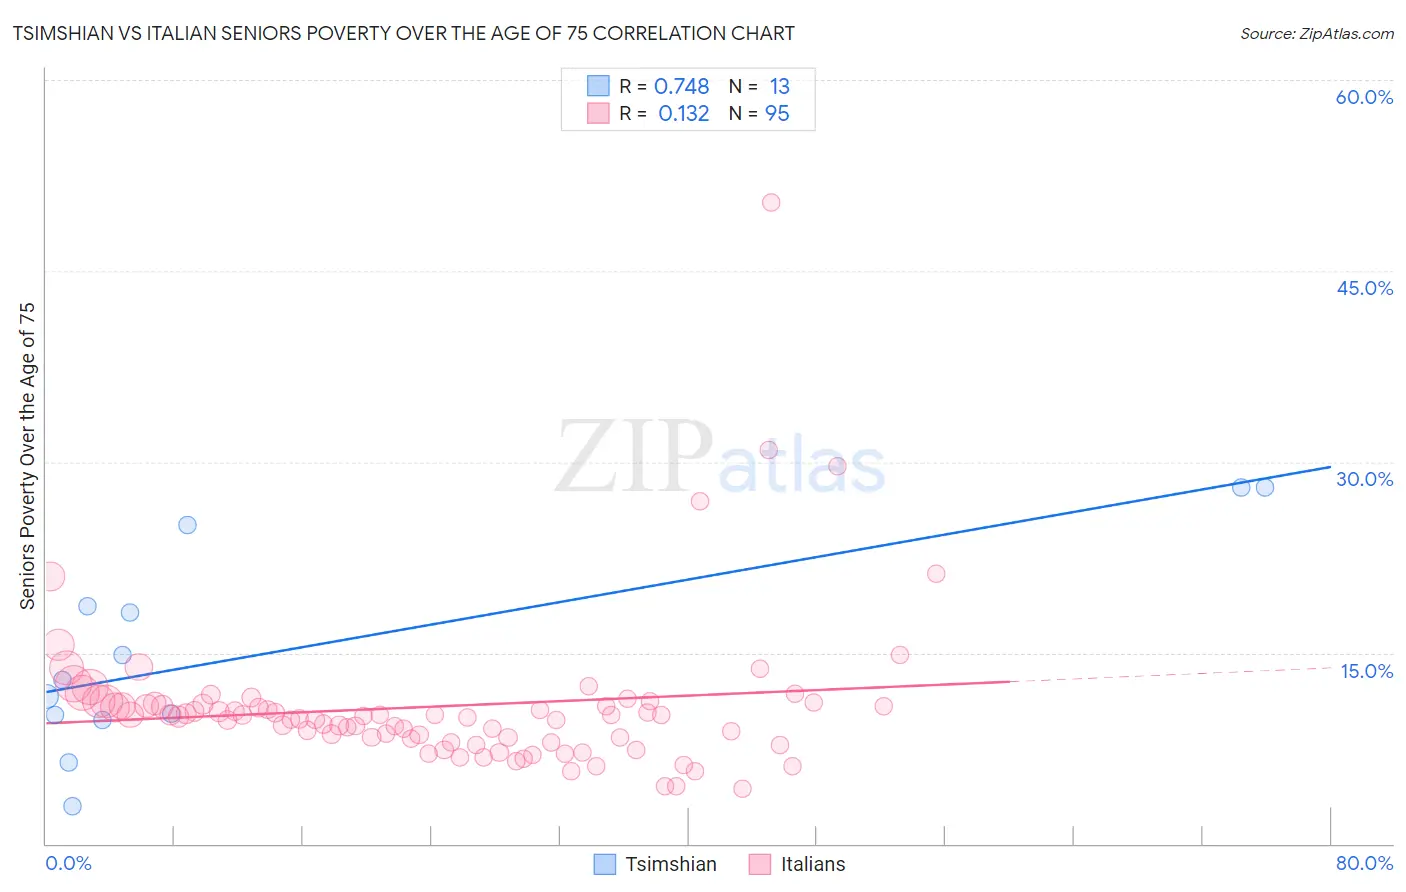
Tsimshian vs Italian Seniors Poverty Over the Age of 75 Correlation Chart
The statistical analysis conducted on geographies consisting of 15,602,839 people shows a strong positive correlation between the proportion of Tsimshian and poverty level among seniors over the age of 75 in the United States with a correlation coefficient (R) of 0.748 and weighted average of 16.1%. Similarly, the statistical analysis conducted on geographies consisting of 557,339,767 people shows a poor positive correlation between the proportion of Italians and poverty level among seniors over the age of 75 in the United States with a correlation coefficient (R) of 0.132 and weighted average of 10.8%, a difference of 49.4%.
Seniors Poverty Over the Age of 75 Correlation Summary
| Measurement | Tsimshian | Italian |
| Minimum | 3.0% | 4.3% |
| Maximum | 27.9% | 50.4% |
| Range | 25.0% | 46.0% |
| Mean | 15.1% | 10.8% |
| Median | 12.9% | 10.0% |
| Interquartile 25% (IQ1) | 9.9% | 8.3% |
| Interquartile 75% (IQ3) | 21.8% | 11.0% |
| Interquartile Range (IQR) | 11.9% | 2.8% |
| Standard Deviation (Sample) | 8.0% | 6.0% |
| Standard Deviation (Population) | 7.7% | 6.0% |
Similar Demographics by Seniors Poverty Over the Age of 75
Demographics Similar to Tsimshian by Seniors Poverty Over the Age of 75
In terms of seniors poverty over the age of 75, the demographic groups most similar to Tsimshian are Guyanese (16.1%, a difference of 0.30%), Immigrants from Ecuador (16.1%, a difference of 0.31%), Barbadian (16.0%, a difference of 0.35%), Crow (15.9%, a difference of 0.83%), and Immigrants from Guyana (16.2%, a difference of 0.93%).
| Demographics | Rating | Rank | Seniors Poverty Over the Age of 75 |
| Immigrants | West Indies | 0.0 /100 | #307 | Tragic 15.8% |
| Immigrants | Bangladesh | 0.0 /100 | #308 | Tragic 15.8% |
| Yup'ik | 0.0 /100 | #309 | Tragic 15.8% |
| Vietnamese | 0.0 /100 | #310 | Tragic 15.9% |
| Trinidadians and Tobagonians | 0.0 /100 | #311 | Tragic 15.9% |
| Crow | 0.0 /100 | #312 | Tragic 15.9% |
| Barbadians | 0.0 /100 | #313 | Tragic 16.0% |
| Tsimshian | 0.0 /100 | #314 | Tragic 16.1% |
| Guyanese | 0.0 /100 | #315 | Tragic 16.1% |
| Immigrants | Ecuador | 0.0 /100 | #316 | Tragic 16.1% |
| Immigrants | Guyana | 0.0 /100 | #317 | Tragic 16.2% |
| Houma | 0.0 /100 | #318 | Tragic 16.2% |
| Haitians | 0.0 /100 | #319 | Tragic 16.2% |
| Immigrants | Yemen | 0.0 /100 | #320 | Tragic 16.5% |
| Immigrants | Haiti | 0.0 /100 | #321 | Tragic 16.5% |
Demographics Similar to Italians by Seniors Poverty Over the Age of 75
In terms of seniors poverty over the age of 75, the demographic groups most similar to Italians are Puget Sound Salish (10.8%, a difference of 0.050%), British (10.7%, a difference of 0.11%), Marshallese (10.7%, a difference of 0.25%), Luxembourger (10.8%, a difference of 0.38%), and Swiss (10.7%, a difference of 0.43%).
| Demographics | Rating | Rank | Seniors Poverty Over the Age of 75 |
| Northern Europeans | 99.8 /100 | #27 | Exceptional 10.7% |
| Irish | 99.8 /100 | #28 | Exceptional 10.7% |
| Assyrians/Chaldeans/Syriacs | 99.8 /100 | #29 | Exceptional 10.7% |
| Swiss | 99.7 /100 | #30 | Exceptional 10.7% |
| Marshallese | 99.7 /100 | #31 | Exceptional 10.7% |
| British | 99.7 /100 | #32 | Exceptional 10.7% |
| Puget Sound Salish | 99.7 /100 | #33 | Exceptional 10.8% |
| Italians | 99.7 /100 | #34 | Exceptional 10.8% |
| Luxembourgers | 99.6 /100 | #35 | Exceptional 10.8% |
| Scotch-Irish | 99.6 /100 | #36 | Exceptional 10.8% |
| Latvians | 99.6 /100 | #37 | Exceptional 10.8% |
| Finns | 99.6 /100 | #38 | Exceptional 10.8% |
| Czechoslovakians | 99.4 /100 | #39 | Exceptional 10.9% |
| Thais | 99.4 /100 | #40 | Exceptional 10.9% |
| Immigrants | Lithuania | 99.2 /100 | #41 | Exceptional 11.0% |