Australian vs Comanche Child Poverty Among Boys Under 16
COMPARE
Australian
Comanche
Child Poverty Among Boys Under 16
Child Poverty Among Boys Under 16 Comparison
Australians
Comanche
14.7%
CHILD POVERTY AMONG BOYS UNDER 16
98.0/ 100
METRIC RATING
74th/ 347
METRIC RANK
20.1%
CHILD POVERTY AMONG BOYS UNDER 16
0.0/ 100
METRIC RATING
282nd/ 347
METRIC RANK
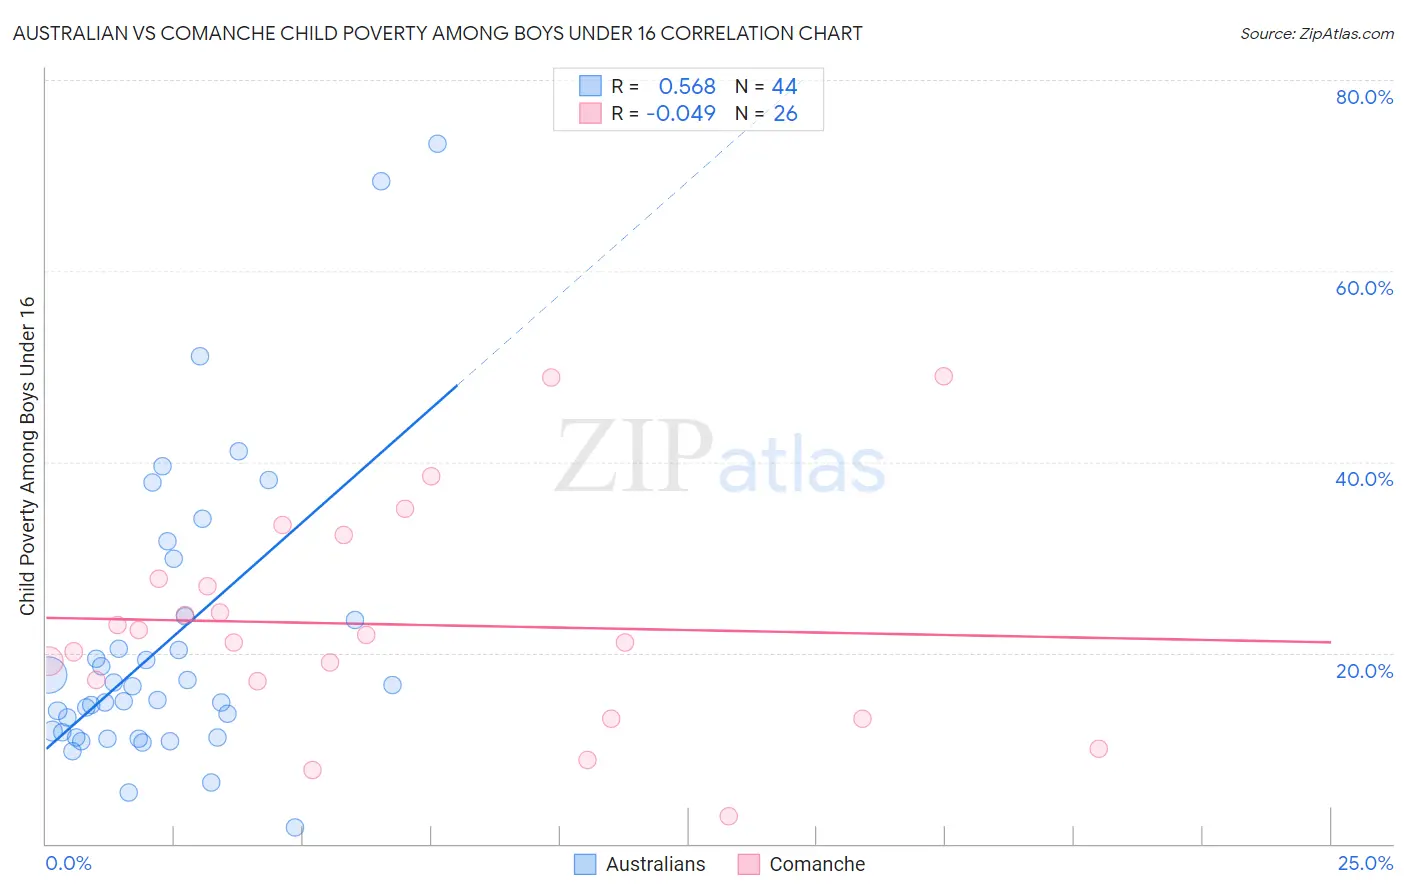
Australian vs Comanche Child Poverty Among Boys Under 16 Correlation Chart
The statistical analysis conducted on geographies consisting of 221,429,706 people shows a substantial positive correlation between the proportion of Australians and poverty level among boys under the age of 16 in the United States with a correlation coefficient (R) of 0.568 and weighted average of 14.7%. Similarly, the statistical analysis conducted on geographies consisting of 109,333,383 people shows no correlation between the proportion of Comanche and poverty level among boys under the age of 16 in the United States with a correlation coefficient (R) of -0.049 and weighted average of 20.1%, a difference of 37.1%.
Child Poverty Among Boys Under 16 Correlation Summary
| Measurement | Australian | Comanche |
| Minimum | 1.7% | 2.8% |
| Maximum | 73.3% | 48.9% |
| Range | 71.6% | 46.1% |
| Mean | 21.1% | 23.0% |
| Median | 15.8% | 21.5% |
| Interquartile 25% (IQ1) | 11.4% | 17.0% |
| Interquartile 75% (IQ3) | 23.6% | 27.8% |
| Interquartile Range (IQR) | 12.2% | 10.9% |
| Standard Deviation (Sample) | 15.3% | 11.5% |
| Standard Deviation (Population) | 15.1% | 11.2% |
Similar Demographics by Child Poverty Among Boys Under 16
Demographics Similar to Australians by Child Poverty Among Boys Under 16
In terms of child poverty among boys under 16, the demographic groups most similar to Australians are Immigrants from Turkey (14.6%, a difference of 0.050%), Immigrants from Poland (14.7%, a difference of 0.070%), Immigrants from Latvia (14.6%, a difference of 0.10%), Immigrants from Netherlands (14.6%, a difference of 0.11%), and Immigrants from Croatia (14.7%, a difference of 0.13%).
| Demographics | Rating | Rank | Child Poverty Among Boys Under 16 |
| Immigrants | Europe | 98.4 /100 | #67 | Exceptional 14.5% |
| Slovenes | 98.4 /100 | #68 | Exceptional 14.5% |
| Immigrants | Austria | 98.4 /100 | #69 | Exceptional 14.5% |
| Europeans | 98.4 /100 | #70 | Exceptional 14.5% |
| Immigrants | Netherlands | 98.1 /100 | #71 | Exceptional 14.6% |
| Immigrants | Latvia | 98.1 /100 | #72 | Exceptional 14.6% |
| Immigrants | Turkey | 98.0 /100 | #73 | Exceptional 14.6% |
| Australians | 98.0 /100 | #74 | Exceptional 14.7% |
| Immigrants | Poland | 97.9 /100 | #75 | Exceptional 14.7% |
| Immigrants | Croatia | 97.9 /100 | #76 | Exceptional 14.7% |
| Macedonians | 97.9 /100 | #77 | Exceptional 14.7% |
| Egyptians | 97.8 /100 | #78 | Exceptional 14.7% |
| Immigrants | Eastern Europe | 97.8 /100 | #79 | Exceptional 14.7% |
| Immigrants | Russia | 97.7 /100 | #80 | Exceptional 14.7% |
| Immigrants | Canada | 97.6 /100 | #81 | Exceptional 14.7% |
Demographics Similar to Comanche by Child Poverty Among Boys Under 16
In terms of child poverty among boys under 16, the demographic groups most similar to Comanche are Immigrants from Zaire (20.1%, a difference of 0.050%), Central American (20.1%, a difference of 0.11%), Immigrants from Jamaica (20.1%, a difference of 0.13%), Bangladeshi (20.0%, a difference of 0.23%), and Immigrants from West Indies (20.0%, a difference of 0.36%).
| Demographics | Rating | Rank | Child Poverty Among Boys Under 16 |
| Jamaicans | 0.0 /100 | #275 | Tragic 20.0% |
| Sub-Saharan Africans | 0.0 /100 | #276 | Tragic 20.0% |
| Immigrants | Barbados | 0.0 /100 | #277 | Tragic 20.0% |
| Immigrants | West Indies | 0.0 /100 | #278 | Tragic 20.0% |
| Bangladeshis | 0.0 /100 | #279 | Tragic 20.0% |
| Central Americans | 0.0 /100 | #280 | Tragic 20.1% |
| Immigrants | Zaire | 0.0 /100 | #281 | Tragic 20.1% |
| Comanche | 0.0 /100 | #282 | Tragic 20.1% |
| Immigrants | Jamaica | 0.0 /100 | #283 | Tragic 20.1% |
| Barbadians | 0.0 /100 | #284 | Tragic 20.2% |
| Arapaho | 0.0 /100 | #285 | Tragic 20.2% |
| West Indians | 0.0 /100 | #286 | Tragic 20.3% |
| Immigrants | Belize | 0.0 /100 | #287 | Tragic 20.3% |
| Immigrants | St. Vincent and the Grenadines | 0.0 /100 | #288 | Tragic 20.3% |
| Blackfeet | 0.0 /100 | #289 | Tragic 20.4% |