Sierra Leonean vs Menominee Female Poverty
COMPARE
Sierra Leonean
Menominee
Female Poverty
Female Poverty Comparison
Sierra Leoneans
Menominee
13.7%
FEMALE POVERTY
33.1/ 100
METRIC RATING
190th/ 347
METRIC RANK
17.6%
FEMALE POVERTY
0.0/ 100
METRIC RATING
322nd/ 347
METRIC RANK
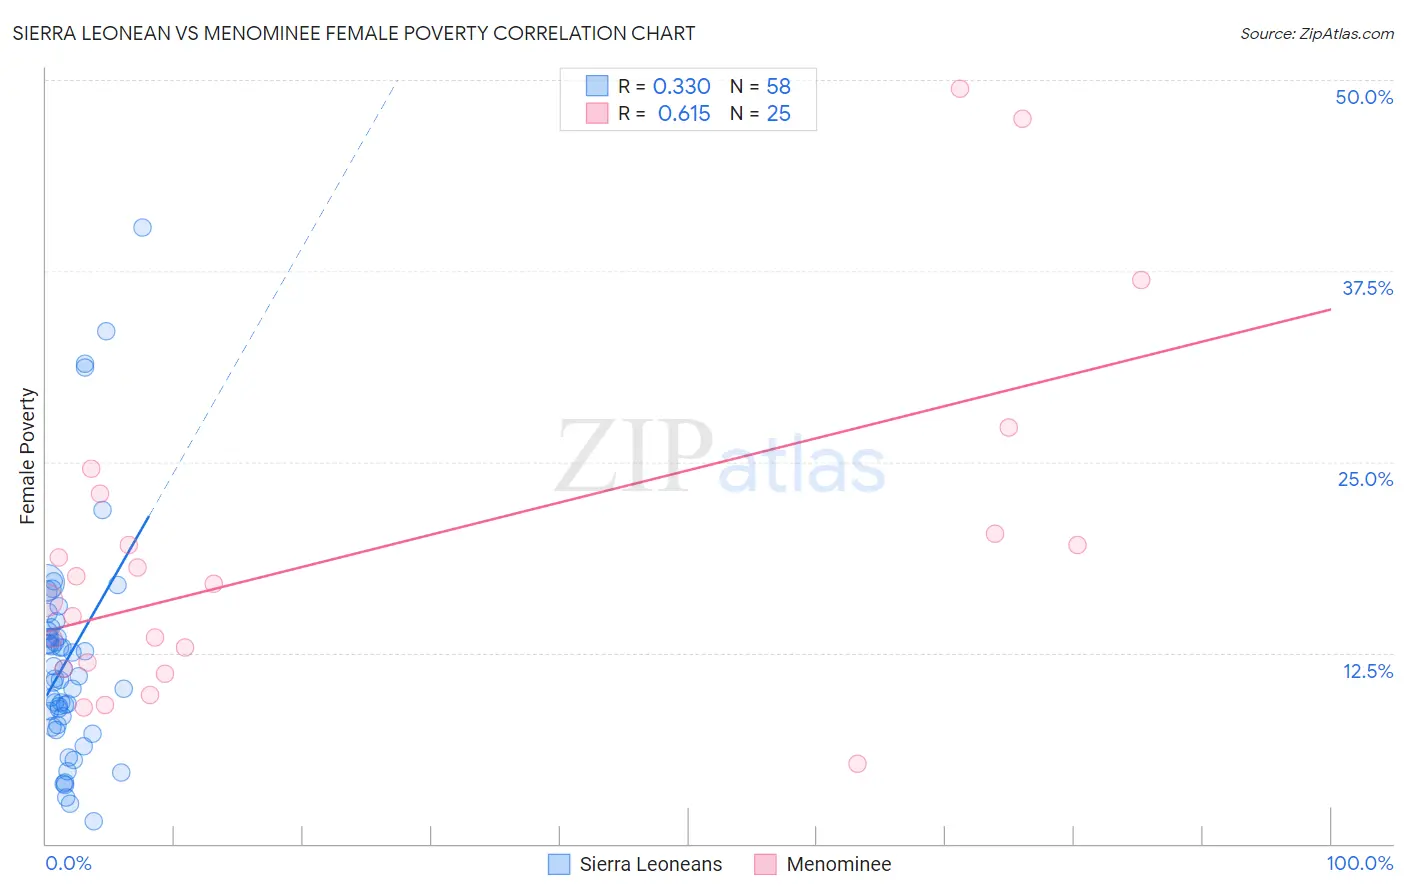
Sierra Leonean vs Menominee Female Poverty Correlation Chart
The statistical analysis conducted on geographies consisting of 83,350,076 people shows a mild positive correlation between the proportion of Sierra Leoneans and poverty level among females in the United States with a correlation coefficient (R) of 0.330 and weighted average of 13.7%. Similarly, the statistical analysis conducted on geographies consisting of 45,777,591 people shows a significant positive correlation between the proportion of Menominee and poverty level among females in the United States with a correlation coefficient (R) of 0.615 and weighted average of 17.6%, a difference of 28.7%.
Female Poverty Correlation Summary
| Measurement | Sierra Leonean | Menominee |
| Minimum | 1.5% | 5.2% |
| Maximum | 40.4% | 49.5% |
| Range | 38.9% | 44.2% |
| Mean | 12.1% | 19.1% |
| Median | 10.9% | 17.0% |
| Interquartile 25% (IQ1) | 7.8% | 11.7% |
| Interquartile 75% (IQ3) | 13.9% | 21.6% |
| Interquartile Range (IQR) | 6.1% | 10.0% |
| Standard Deviation (Sample) | 7.4% | 11.1% |
| Standard Deviation (Population) | 7.4% | 10.9% |
Similar Demographics by Female Poverty
Demographics Similar to Sierra Leoneans by Female Poverty
In terms of female poverty, the demographic groups most similar to Sierra Leoneans are Immigrants from Kuwait (13.7%, a difference of 0.040%), Immigrants from Costa Rica (13.7%, a difference of 0.13%), Iraqi (13.7%, a difference of 0.14%), Delaware (13.7%, a difference of 0.21%), and Immigrants from South America (13.7%, a difference of 0.27%).
| Demographics | Rating | Rank | Female Poverty |
| Kenyans | 43.8 /100 | #183 | Average 13.5% |
| Immigrants | Sierra Leone | 43.2 /100 | #184 | Average 13.5% |
| Immigrants | Cameroon | 42.0 /100 | #185 | Average 13.5% |
| Immigrants | Portugal | 41.5 /100 | #186 | Average 13.6% |
| Immigrants | Venezuela | 41.0 /100 | #187 | Average 13.6% |
| Hawaiians | 39.9 /100 | #188 | Fair 13.6% |
| Uruguayans | 39.8 /100 | #189 | Fair 13.6% |
| Sierra Leoneans | 33.1 /100 | #190 | Fair 13.7% |
| Immigrants | Kuwait | 32.7 /100 | #191 | Fair 13.7% |
| Immigrants | Costa Rica | 31.9 /100 | #192 | Fair 13.7% |
| Iraqis | 31.8 /100 | #193 | Fair 13.7% |
| Delaware | 31.1 /100 | #194 | Fair 13.7% |
| Immigrants | South America | 30.6 /100 | #195 | Fair 13.7% |
| South American Indians | 28.9 /100 | #196 | Fair 13.7% |
| Arabs | 28.6 /100 | #197 | Fair 13.7% |
Demographics Similar to Menominee by Female Poverty
In terms of female poverty, the demographic groups most similar to Menominee are Paiute (17.7%, a difference of 0.59%), Arapaho (17.5%, a difference of 0.65%), Immigrants from Dominica (17.5%, a difference of 0.72%), Immigrants from Honduras (17.7%, a difference of 0.77%), and Cajun (17.5%, a difference of 0.80%).
| Demographics | Rating | Rank | Female Poverty |
| U.S. Virgin Islanders | 0.0 /100 | #315 | Tragic 17.3% |
| Hondurans | 0.0 /100 | #316 | Tragic 17.4% |
| Immigrants | Congo | 0.0 /100 | #317 | Tragic 17.4% |
| Ute | 0.0 /100 | #318 | Tragic 17.5% |
| Cajuns | 0.0 /100 | #319 | Tragic 17.5% |
| Immigrants | Dominica | 0.0 /100 | #320 | Tragic 17.5% |
| Arapaho | 0.0 /100 | #321 | Tragic 17.5% |
| Menominee | 0.0 /100 | #322 | Tragic 17.6% |
| Paiute | 0.0 /100 | #323 | Tragic 17.7% |
| Immigrants | Honduras | 0.0 /100 | #324 | Tragic 17.7% |
| Colville | 0.0 /100 | #325 | Tragic 17.8% |
| Central American Indians | 0.0 /100 | #326 | Tragic 18.0% |
| Yakama | 0.0 /100 | #327 | Tragic 18.0% |
| Blacks/African Americans | 0.0 /100 | #328 | Tragic 18.6% |
| Kiowa | 0.0 /100 | #329 | Tragic 18.6% |