Sierra Leonean vs Paraguayan Female Poverty
COMPARE
Sierra Leonean
Paraguayan
Female Poverty
Female Poverty Comparison
Sierra Leoneans
Paraguayans
13.7%
FEMALE POVERTY
33.1/ 100
METRIC RATING
190th/ 347
METRIC RANK
12.6%
FEMALE POVERTY
93.0/ 100
METRIC RATING
110th/ 347
METRIC RANK
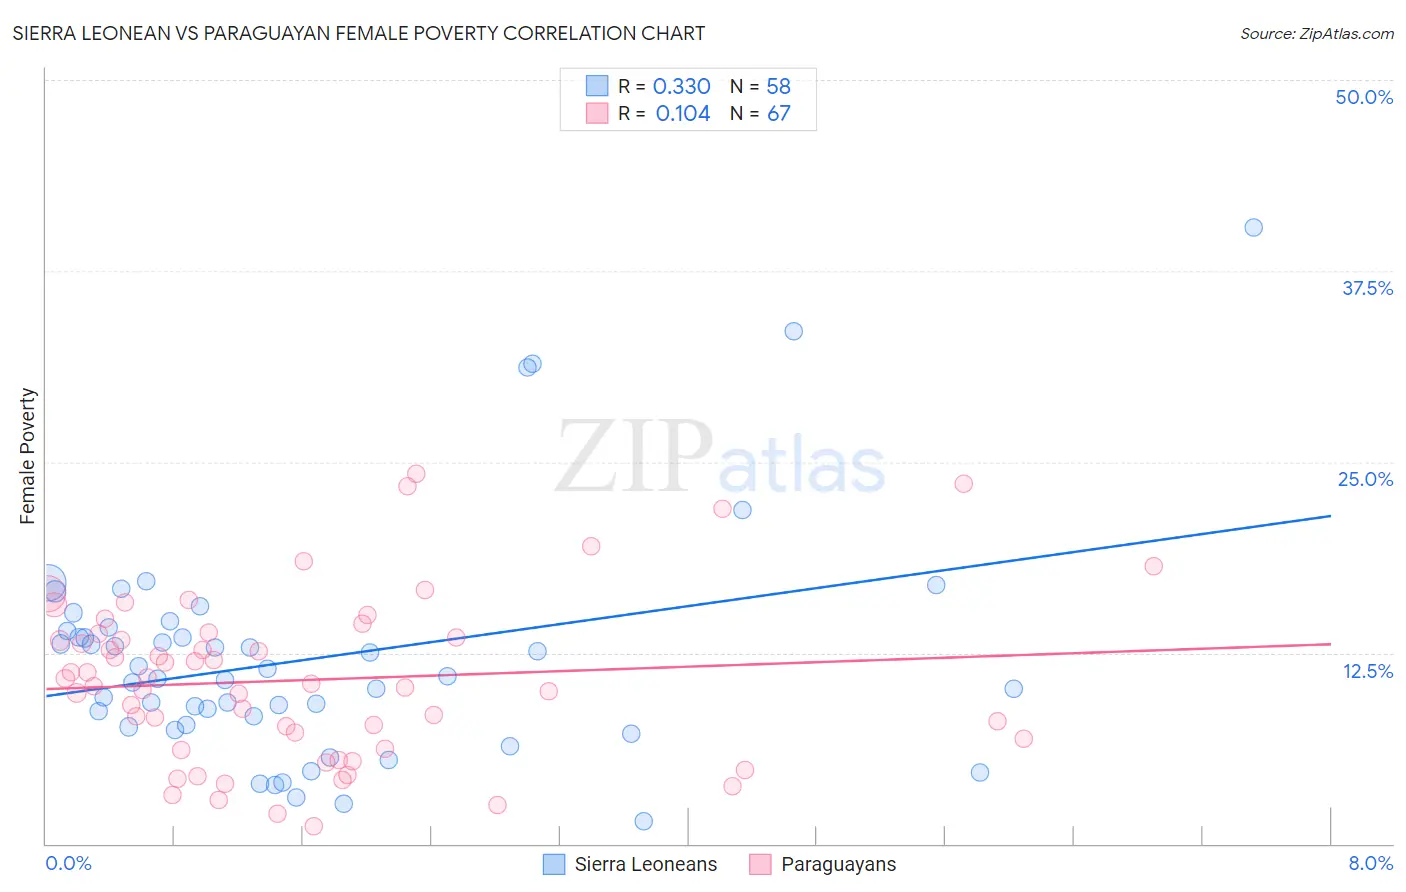
Sierra Leonean vs Paraguayan Female Poverty Correlation Chart
The statistical analysis conducted on geographies consisting of 83,350,076 people shows a mild positive correlation between the proportion of Sierra Leoneans and poverty level among females in the United States with a correlation coefficient (R) of 0.330 and weighted average of 13.7%. Similarly, the statistical analysis conducted on geographies consisting of 95,097,647 people shows a poor positive correlation between the proportion of Paraguayans and poverty level among females in the United States with a correlation coefficient (R) of 0.104 and weighted average of 12.6%, a difference of 8.5%.
Female Poverty Correlation Summary
| Measurement | Sierra Leonean | Paraguayan |
| Minimum | 1.5% | 1.2% |
| Maximum | 40.4% | 24.2% |
| Range | 38.9% | 23.0% |
| Mean | 12.1% | 10.7% |
| Median | 10.9% | 10.5% |
| Interquartile 25% (IQ1) | 7.8% | 6.2% |
| Interquartile 75% (IQ3) | 13.9% | 13.8% |
| Interquartile Range (IQR) | 6.1% | 7.6% |
| Standard Deviation (Sample) | 7.4% | 5.4% |
| Standard Deviation (Population) | 7.4% | 5.4% |
Similar Demographics by Female Poverty
Demographics Similar to Sierra Leoneans by Female Poverty
In terms of female poverty, the demographic groups most similar to Sierra Leoneans are Immigrants from Kuwait (13.7%, a difference of 0.040%), Immigrants from Costa Rica (13.7%, a difference of 0.13%), Iraqi (13.7%, a difference of 0.14%), Delaware (13.7%, a difference of 0.21%), and Immigrants from South America (13.7%, a difference of 0.27%).
| Demographics | Rating | Rank | Female Poverty |
| Kenyans | 43.8 /100 | #183 | Average 13.5% |
| Immigrants | Sierra Leone | 43.2 /100 | #184 | Average 13.5% |
| Immigrants | Cameroon | 42.0 /100 | #185 | Average 13.5% |
| Immigrants | Portugal | 41.5 /100 | #186 | Average 13.6% |
| Immigrants | Venezuela | 41.0 /100 | #187 | Average 13.6% |
| Hawaiians | 39.9 /100 | #188 | Fair 13.6% |
| Uruguayans | 39.8 /100 | #189 | Fair 13.6% |
| Sierra Leoneans | 33.1 /100 | #190 | Fair 13.7% |
| Immigrants | Kuwait | 32.7 /100 | #191 | Fair 13.7% |
| Immigrants | Costa Rica | 31.9 /100 | #192 | Fair 13.7% |
| Iraqis | 31.8 /100 | #193 | Fair 13.7% |
| Delaware | 31.1 /100 | #194 | Fair 13.7% |
| Immigrants | South America | 30.6 /100 | #195 | Fair 13.7% |
| South American Indians | 28.9 /100 | #196 | Fair 13.7% |
| Arabs | 28.6 /100 | #197 | Fair 13.7% |
Demographics Similar to Paraguayans by Female Poverty
In terms of female poverty, the demographic groups most similar to Paraguayans are Immigrants from Zimbabwe (12.6%, a difference of 0.030%), Portuguese (12.6%, a difference of 0.040%), Laotian (12.6%, a difference of 0.15%), Soviet Union (12.6%, a difference of 0.22%), and Immigrants from Turkey (12.6%, a difference of 0.33%).
| Demographics | Rating | Rank | Female Poverty |
| Slavs | 94.5 /100 | #103 | Exceptional 12.5% |
| Palestinians | 94.3 /100 | #104 | Exceptional 12.5% |
| Scottish | 94.1 /100 | #105 | Exceptional 12.5% |
| Immigrants | Turkey | 93.8 /100 | #106 | Exceptional 12.6% |
| Laotians | 93.4 /100 | #107 | Exceptional 12.6% |
| Portuguese | 93.1 /100 | #108 | Exceptional 12.6% |
| Immigrants | Zimbabwe | 93.1 /100 | #109 | Exceptional 12.6% |
| Paraguayans | 93.0 /100 | #110 | Exceptional 12.6% |
| Soviet Union | 92.4 /100 | #111 | Exceptional 12.6% |
| Immigrants | Israel | 92.0 /100 | #112 | Exceptional 12.6% |
| Canadians | 92.0 /100 | #113 | Exceptional 12.7% |
| Welsh | 91.6 /100 | #114 | Exceptional 12.7% |
| Puget Sound Salish | 91.5 /100 | #115 | Exceptional 12.7% |
| Immigrants | Russia | 91.2 /100 | #116 | Exceptional 12.7% |
| Immigrants | Southern Europe | 90.9 /100 | #117 | Exceptional 12.7% |