Sierra Leonean vs Honduran Seniors Poverty Over the Age of 65
COMPARE
Sierra Leonean
Honduran
Seniors Poverty Over the Age of 65
Seniors Poverty Over the Age of 65 Comparison
Sierra Leoneans
Hondurans
10.5%
SENIORS POVERTY OVER THE AGE OF 65
86.8/ 100
METRIC RATING
134th/ 347
METRIC RANK
14.2%
SENIORS POVERTY OVER THE AGE OF 65
0.0/ 100
METRIC RATING
309th/ 347
METRIC RANK
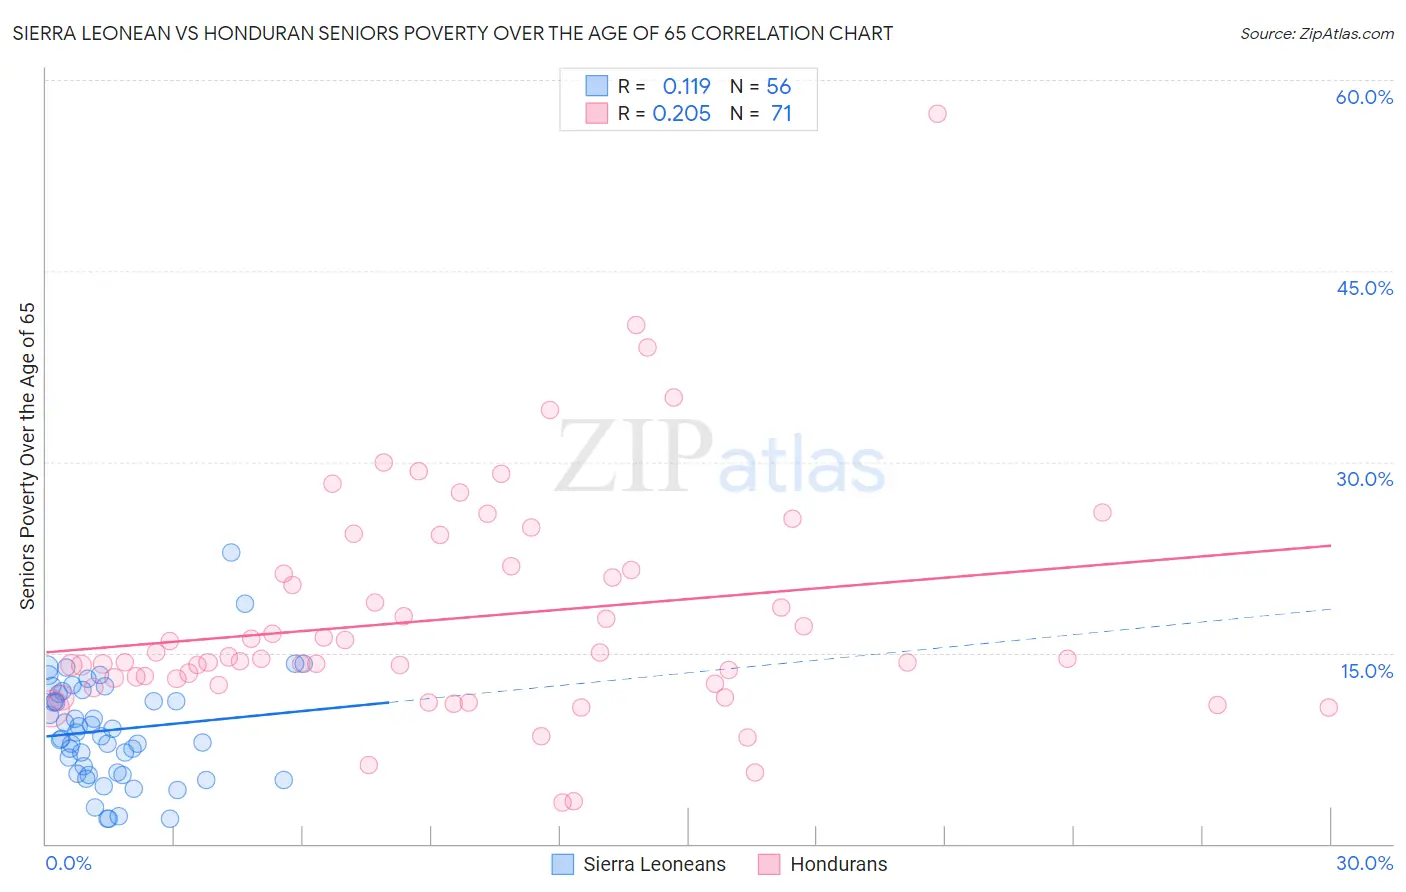
Sierra Leonean vs Honduran Seniors Poverty Over the Age of 65 Correlation Chart
The statistical analysis conducted on geographies consisting of 83,269,460 people shows a poor positive correlation between the proportion of Sierra Leoneans and poverty level among seniors over the age of 65 in the United States with a correlation coefficient (R) of 0.119 and weighted average of 10.5%. Similarly, the statistical analysis conducted on geographies consisting of 356,735,530 people shows a weak positive correlation between the proportion of Hondurans and poverty level among seniors over the age of 65 in the United States with a correlation coefficient (R) of 0.205 and weighted average of 14.2%, a difference of 35.5%.
Seniors Poverty Over the Age of 65 Correlation Summary
| Measurement | Sierra Leonean | Honduran |
| Minimum | 1.9% | 3.3% |
| Maximum | 22.9% | 57.4% |
| Range | 21.0% | 54.1% |
| Mean | 9.0% | 17.7% |
| Median | 8.6% | 14.6% |
| Interquartile 25% (IQ1) | 5.5% | 12.6% |
| Interquartile 75% (IQ3) | 11.9% | 21.5% |
| Interquartile Range (IQR) | 6.3% | 8.9% |
| Standard Deviation (Sample) | 4.2% | 9.1% |
| Standard Deviation (Population) | 4.1% | 9.1% |
Similar Demographics by Seniors Poverty Over the Age of 65
Demographics Similar to Sierra Leoneans by Seniors Poverty Over the Age of 65
In terms of seniors poverty over the age of 65, the demographic groups most similar to Sierra Leoneans are Immigrants from Norway (10.5%, a difference of 0.060%), Immigrants from Serbia (10.5%, a difference of 0.070%), Guamanian/Chamorro (10.5%, a difference of 0.15%), Immigrants from Turkey (10.5%, a difference of 0.19%), and Egyptian (10.5%, a difference of 0.20%).
| Demographics | Rating | Rank | Seniors Poverty Over the Age of 65 |
| Cambodians | 89.1 /100 | #127 | Excellent 10.4% |
| Ottawa | 88.5 /100 | #128 | Excellent 10.4% |
| Immigrants | Iran | 88.4 /100 | #129 | Excellent 10.4% |
| Immigrants | Oceania | 88.4 /100 | #130 | Excellent 10.4% |
| Egyptians | 87.8 /100 | #131 | Excellent 10.5% |
| Immigrants | Turkey | 87.7 /100 | #132 | Excellent 10.5% |
| Guamanians/Chamorros | 87.5 /100 | #133 | Excellent 10.5% |
| Sierra Leoneans | 86.8 /100 | #134 | Excellent 10.5% |
| Immigrants | Norway | 86.5 /100 | #135 | Excellent 10.5% |
| Immigrants | Serbia | 86.4 /100 | #136 | Excellent 10.5% |
| Immigrants | Australia | 85.1 /100 | #137 | Excellent 10.5% |
| Immigrants | Latvia | 84.7 /100 | #138 | Excellent 10.5% |
| Portuguese | 84.1 /100 | #139 | Excellent 10.5% |
| Immigrants | Kenya | 83.4 /100 | #140 | Excellent 10.5% |
| Immigrants | Europe | 83.3 /100 | #141 | Excellent 10.5% |
Demographics Similar to Hondurans by Seniors Poverty Over the Age of 65
In terms of seniors poverty over the age of 65, the demographic groups most similar to Hondurans are Trinidadian and Tobagonian (14.2%, a difference of 0.10%), Immigrants from West Indies (14.2%, a difference of 0.17%), Bahamian (14.2%, a difference of 0.26%), Native/Alaskan (14.2%, a difference of 0.27%), and Immigrants from Latin America (14.2%, a difference of 0.31%).
| Demographics | Rating | Rank | Seniors Poverty Over the Age of 65 |
| Yup'ik | 0.0 /100 | #302 | Tragic 14.1% |
| Immigrants | Bangladesh | 0.0 /100 | #303 | Tragic 14.1% |
| West Indians | 0.0 /100 | #304 | Tragic 14.1% |
| Immigrants | Trinidad and Tobago | 0.0 /100 | #305 | Tragic 14.1% |
| Immigrants | Latin America | 0.0 /100 | #306 | Tragic 14.2% |
| Immigrants | West Indies | 0.0 /100 | #307 | Tragic 14.2% |
| Trinidadians and Tobagonians | 0.0 /100 | #308 | Tragic 14.2% |
| Hondurans | 0.0 /100 | #309 | Tragic 14.2% |
| Bahamians | 0.0 /100 | #310 | Tragic 14.2% |
| Natives/Alaskans | 0.0 /100 | #311 | Tragic 14.2% |
| Hispanics or Latinos | 0.0 /100 | #312 | Tragic 14.3% |
| Barbadians | 0.0 /100 | #313 | Tragic 14.4% |
| Guyanese | 0.0 /100 | #314 | Tragic 14.4% |
| Immigrants | Ecuador | 0.0 /100 | #315 | Tragic 14.4% |
| Immigrants | Guyana | 0.0 /100 | #316 | Tragic 14.5% |