Sierra Leonean vs Immigrants from Africa 10th Grade
COMPARE
Sierra Leonean
Immigrants from Africa
10th Grade
10th Grade Comparison
Sierra Leoneans
Immigrants from Africa
93.7%
10TH GRADE
46.1/ 100
METRIC RATING
178th/ 347
METRIC RANK
93.1%
10TH GRADE
5.0/ 100
METRIC RATING
230th/ 347
METRIC RANK
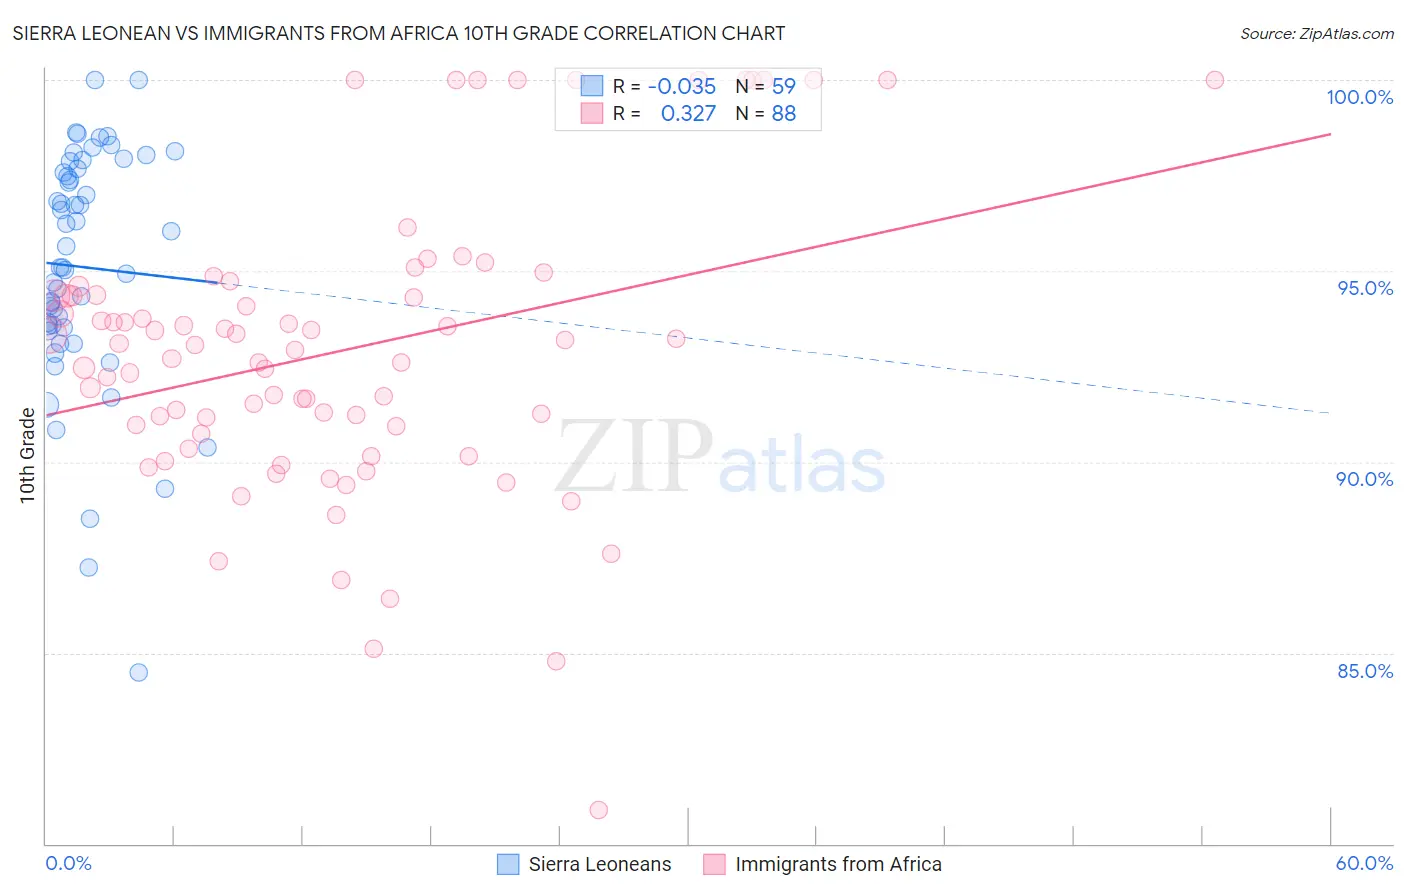
Sierra Leonean vs Immigrants from Africa 10th Grade Correlation Chart
The statistical analysis conducted on geographies consisting of 83,357,120 people shows no correlation between the proportion of Sierra Leoneans and percentage of population with at least 10th grade education in the United States with a correlation coefficient (R) of -0.035 and weighted average of 93.7%. Similarly, the statistical analysis conducted on geographies consisting of 469,408,495 people shows a mild positive correlation between the proportion of Immigrants from Africa and percentage of population with at least 10th grade education in the United States with a correlation coefficient (R) of 0.327 and weighted average of 93.1%, a difference of 0.63%.
10th Grade Correlation Summary
| Measurement | Sierra Leonean | Immigrants from Africa |
| Minimum | 84.5% | 80.9% |
| Maximum | 100.0% | 100.0% |
| Range | 15.5% | 19.1% |
| Mean | 95.1% | 92.9% |
| Median | 95.1% | 93.0% |
| Interquartile 25% (IQ1) | 93.5% | 90.8% |
| Interquartile 75% (IQ3) | 97.7% | 94.4% |
| Interquartile Range (IQR) | 4.2% | 3.5% |
| Standard Deviation (Sample) | 3.2% | 3.8% |
| Standard Deviation (Population) | 3.1% | 3.8% |
Similar Demographics by 10th Grade
Demographics Similar to Sierra Leoneans by 10th Grade
In terms of 10th grade, the demographic groups most similar to Sierra Leoneans are Immigrants from Argentina (93.7%, a difference of 0.010%), Immigrants from Lebanon (93.7%, a difference of 0.010%), Paraguayan (93.7%, a difference of 0.010%), Argentinean (93.7%, a difference of 0.030%), and Immigrants from Nepal (93.7%, a difference of 0.030%).
| Demographics | Rating | Rank | 10th Grade |
| Immigrants | Albania | 52.4 /100 | #171 | Average 93.8% |
| French American Indians | 50.9 /100 | #172 | Average 93.7% |
| Spaniards | 50.3 /100 | #173 | Average 93.7% |
| Argentineans | 50.0 /100 | #174 | Average 93.7% |
| Immigrants | Nepal | 49.6 /100 | #175 | Average 93.7% |
| Immigrants | Argentina | 47.1 /100 | #176 | Average 93.7% |
| Immigrants | Lebanon | 47.1 /100 | #177 | Average 93.7% |
| Sierra Leoneans | 46.1 /100 | #178 | Average 93.7% |
| Paraguayans | 45.3 /100 | #179 | Average 93.7% |
| Blackfeet | 42.8 /100 | #180 | Average 93.7% |
| Immigrants | Northern Africa | 41.6 /100 | #181 | Average 93.7% |
| Colville | 38.8 /100 | #182 | Fair 93.6% |
| Guamanians/Chamorros | 37.1 /100 | #183 | Fair 93.6% |
| Choctaw | 36.6 /100 | #184 | Fair 93.6% |
| Sudanese | 36.6 /100 | #185 | Fair 93.6% |
Demographics Similar to Immigrants from Africa by 10th Grade
In terms of 10th grade, the demographic groups most similar to Immigrants from Africa are Immigrants from Ethiopia (93.1%, a difference of 0.0%), South American Indian (93.1%, a difference of 0.010%), Bahamian (93.1%, a difference of 0.010%), Comanche (93.1%, a difference of 0.010%), and Subsaharan African (93.1%, a difference of 0.020%).
| Demographics | Rating | Rank | 10th Grade |
| Immigrants | Sierra Leone | 7.6 /100 | #223 | Tragic 93.2% |
| Bolivians | 6.7 /100 | #224 | Tragic 93.2% |
| Somalis | 6.2 /100 | #225 | Tragic 93.2% |
| Koreans | 6.1 /100 | #226 | Tragic 93.2% |
| Blacks/African Americans | 6.0 /100 | #227 | Tragic 93.2% |
| Immigrants | China | 5.9 /100 | #228 | Tragic 93.2% |
| Immigrants | Ethiopia | 5.1 /100 | #229 | Tragic 93.1% |
| Immigrants | Africa | 5.0 /100 | #230 | Tragic 93.1% |
| South American Indians | 4.9 /100 | #231 | Tragic 93.1% |
| Bahamians | 4.9 /100 | #232 | Tragic 93.1% |
| Comanche | 4.9 /100 | #233 | Tragic 93.1% |
| Sub-Saharan Africans | 4.7 /100 | #234 | Tragic 93.1% |
| Africans | 4.6 /100 | #235 | Tragic 93.1% |
| Afghans | 4.5 /100 | #236 | Tragic 93.1% |
| Immigrants | Panama | 4.3 /100 | #237 | Tragic 93.1% |