Sierra Leonean vs Honduran 1st Grade
COMPARE
Sierra Leonean
Honduran
1st Grade
1st Grade Comparison
Sierra Leoneans
Hondurans
97.7%
1ST GRADE
3.6/ 100
METRIC RATING
227th/ 347
METRIC RANK
96.9%
1ST GRADE
0.0/ 100
METRIC RATING
314th/ 347
METRIC RANK
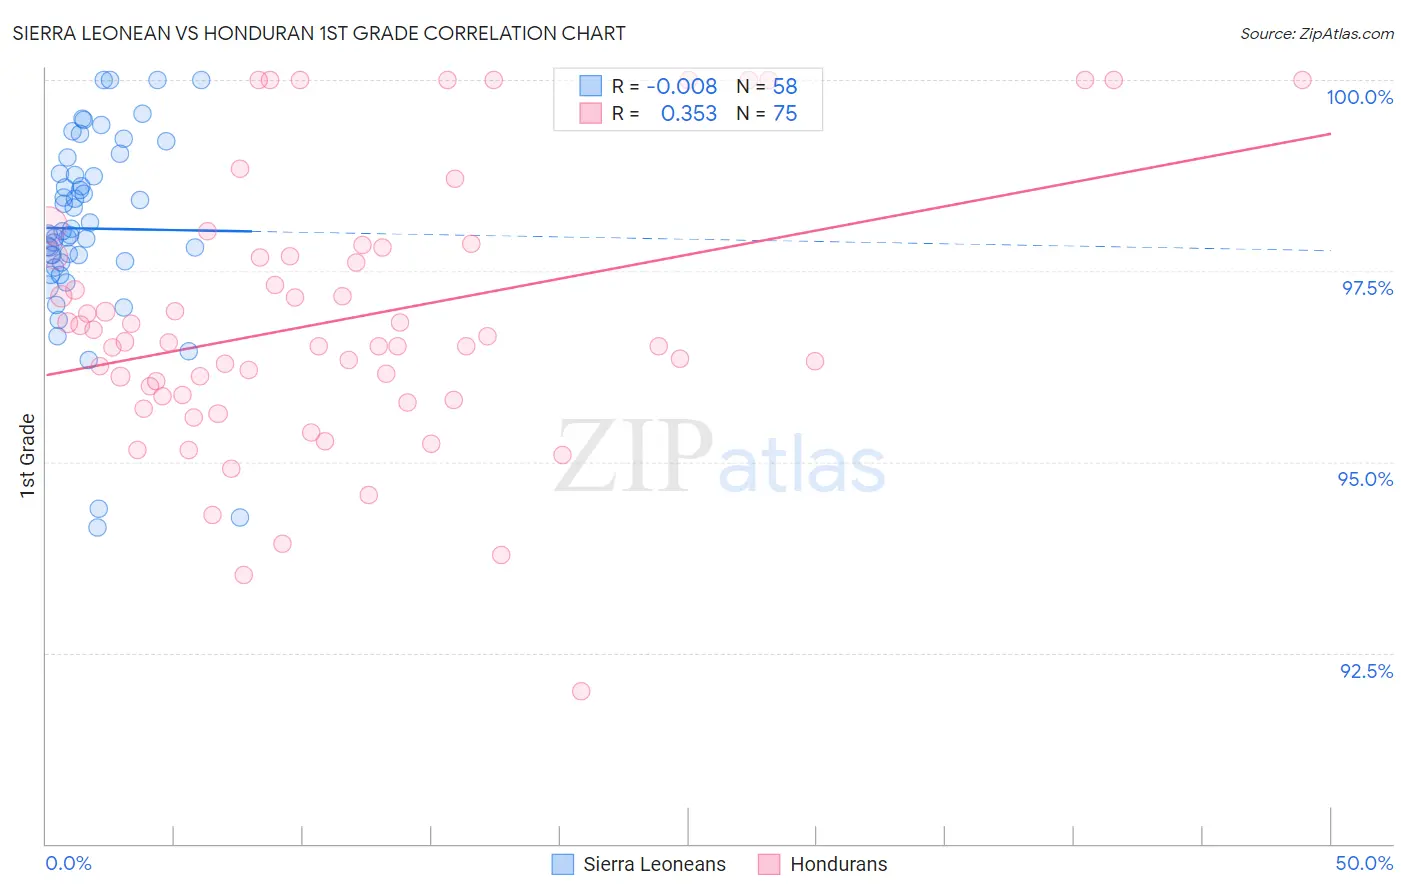
Sierra Leonean vs Honduran 1st Grade Correlation Chart
The statistical analysis conducted on geographies consisting of 83,337,655 people shows no correlation between the proportion of Sierra Leoneans and percentage of population with at least 1st grade education in the United States with a correlation coefficient (R) of -0.008 and weighted average of 97.7%. Similarly, the statistical analysis conducted on geographies consisting of 357,783,041 people shows a mild positive correlation between the proportion of Hondurans and percentage of population with at least 1st grade education in the United States with a correlation coefficient (R) of 0.353 and weighted average of 96.9%, a difference of 0.82%.
1st Grade Correlation Summary
| Measurement | Sierra Leonean | Honduran |
| Minimum | 94.1% | 92.0% |
| Maximum | 100.0% | 100.0% |
| Range | 5.9% | 8.0% |
| Mean | 98.1% | 96.9% |
| Median | 98.0% | 96.6% |
| Interquartile 25% (IQ1) | 97.6% | 95.9% |
| Interquartile 75% (IQ3) | 98.8% | 97.7% |
| Interquartile Range (IQR) | 1.2% | 1.8% |
| Standard Deviation (Sample) | 1.3% | 1.7% |
| Standard Deviation (Population) | 1.3% | 1.7% |
Similar Demographics by 1st Grade
Demographics Similar to Sierra Leoneans by 1st Grade
In terms of 1st grade, the demographic groups most similar to Sierra Leoneans are Sudanese (97.7%, a difference of 0.0%), Subsaharan African (97.7%, a difference of 0.0%), Immigrants from Costa Rica (97.7%, a difference of 0.0%), Senegalese (97.7%, a difference of 0.0%), and Immigrants from Sudan (97.7%, a difference of 0.010%).
| Demographics | Rating | Rank | 1st Grade |
| Tongans | 4.6 /100 | #220 | Tragic 97.7% |
| Immigrants | Sudan | 4.3 /100 | #221 | Tragic 97.7% |
| Immigrants | Syria | 4.2 /100 | #222 | Tragic 97.7% |
| Immigrants | Zaire | 4.1 /100 | #223 | Tragic 97.7% |
| Iraqis | 4.0 /100 | #224 | Tragic 97.7% |
| Immigrants | Nepal | 4.0 /100 | #225 | Tragic 97.7% |
| Sudanese | 3.7 /100 | #226 | Tragic 97.7% |
| Sierra Leoneans | 3.6 /100 | #227 | Tragic 97.7% |
| Sub-Saharan Africans | 3.6 /100 | #228 | Tragic 97.7% |
| Immigrants | Costa Rica | 3.5 /100 | #229 | Tragic 97.7% |
| Senegalese | 3.5 /100 | #230 | Tragic 97.7% |
| Puerto Ricans | 3.0 /100 | #231 | Tragic 97.7% |
| Immigrants | Uruguay | 2.5 /100 | #232 | Tragic 97.6% |
| Immigrants | Pakistan | 2.2 /100 | #233 | Tragic 97.6% |
| Colombians | 2.2 /100 | #234 | Tragic 97.6% |
Demographics Similar to Hondurans by 1st Grade
In terms of 1st grade, the demographic groups most similar to Hondurans are Immigrants from Belize (96.9%, a difference of 0.010%), Cape Verdean (96.9%, a difference of 0.020%), Guyanese (96.9%, a difference of 0.020%), Immigrants from Ecuador (96.9%, a difference of 0.020%), and Immigrants from Nicaragua (96.9%, a difference of 0.020%).
| Demographics | Rating | Rank | 1st Grade |
| Immigrants | Somalia | 0.0 /100 | #307 | Tragic 96.9% |
| Hispanics or Latinos | 0.0 /100 | #308 | Tragic 96.9% |
| Immigrants | Haiti | 0.0 /100 | #309 | Tragic 96.9% |
| Immigrants | Azores | 0.0 /100 | #310 | Tragic 96.9% |
| Sri Lankans | 0.0 /100 | #311 | Tragic 96.9% |
| Cape Verdeans | 0.0 /100 | #312 | Tragic 96.9% |
| Guyanese | 0.0 /100 | #313 | Tragic 96.9% |
| Hondurans | 0.0 /100 | #314 | Tragic 96.9% |
| Immigrants | Belize | 0.0 /100 | #315 | Tragic 96.9% |
| Immigrants | Ecuador | 0.0 /100 | #316 | Tragic 96.9% |
| Immigrants | Nicaragua | 0.0 /100 | #317 | Tragic 96.9% |
| Immigrants | Laos | 0.0 /100 | #318 | Tragic 96.8% |
| Immigrants | Guyana | 0.0 /100 | #319 | Tragic 96.8% |
| Immigrants | Burma/Myanmar | 0.0 /100 | #320 | Tragic 96.8% |
| Immigrants | Bangladesh | 0.0 /100 | #321 | Tragic 96.8% |