Immigrants from Bulgaria vs Honduran Seniors Poverty Over the Age of 65
COMPARE
Immigrants from Bulgaria
Honduran
Seniors Poverty Over the Age of 65
Seniors Poverty Over the Age of 65 Comparison
Immigrants from Bulgaria
Hondurans
10.1%
SENIORS POVERTY OVER THE AGE OF 65
97.0/ 100
METRIC RATING
89th/ 347
METRIC RANK
14.2%
SENIORS POVERTY OVER THE AGE OF 65
0.0/ 100
METRIC RATING
309th/ 347
METRIC RANK
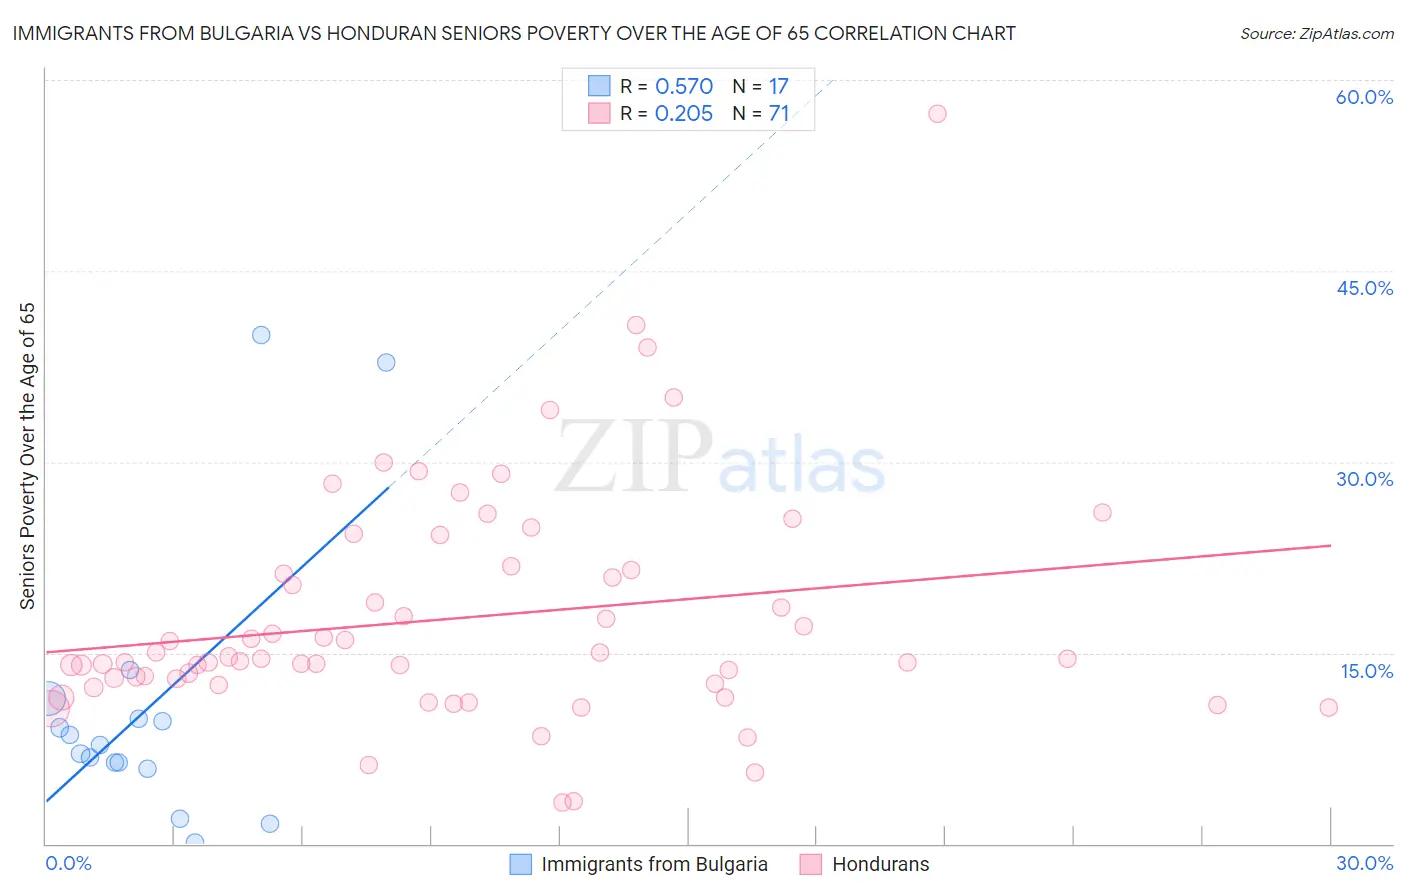
Immigrants from Bulgaria vs Honduran Seniors Poverty Over the Age of 65 Correlation Chart
The statistical analysis conducted on geographies consisting of 172,435,025 people shows a substantial positive correlation between the proportion of Immigrants from Bulgaria and poverty level among seniors over the age of 65 in the United States with a correlation coefficient (R) of 0.570 and weighted average of 10.1%. Similarly, the statistical analysis conducted on geographies consisting of 356,735,530 people shows a weak positive correlation between the proportion of Hondurans and poverty level among seniors over the age of 65 in the United States with a correlation coefficient (R) of 0.205 and weighted average of 14.2%, a difference of 40.7%.
Seniors Poverty Over the Age of 65 Correlation Summary
| Measurement | Immigrants from Bulgaria | Honduran |
| Minimum | 0.093% | 3.3% |
| Maximum | 40.0% | 57.4% |
| Range | 39.9% | 54.1% |
| Mean | 10.8% | 17.7% |
| Median | 7.7% | 14.6% |
| Interquartile 25% (IQ1) | 6.1% | 12.6% |
| Interquartile 75% (IQ3) | 10.6% | 21.5% |
| Interquartile Range (IQR) | 4.5% | 8.9% |
| Standard Deviation (Sample) | 11.1% | 9.1% |
| Standard Deviation (Population) | 10.8% | 9.1% |
Similar Demographics by Seniors Poverty Over the Age of 65
Demographics Similar to Immigrants from Bulgaria by Seniors Poverty Over the Age of 65
In terms of seniors poverty over the age of 65, the demographic groups most similar to Immigrants from Bulgaria are Ukrainian (10.1%, a difference of 0.060%), Jordanian (10.1%, a difference of 0.080%), Puget Sound Salish (10.1%, a difference of 0.080%), Immigrants from Singapore (10.1%, a difference of 0.10%), and Burmese (10.1%, a difference of 0.13%).
| Demographics | Rating | Rank | Seniors Poverty Over the Age of 65 |
| Immigrants | Bolivia | 97.3 /100 | #82 | Exceptional 10.1% |
| Immigrants | Poland | 97.2 /100 | #83 | Exceptional 10.1% |
| Immigrants | Afghanistan | 97.2 /100 | #84 | Exceptional 10.1% |
| Immigrants | Nepal | 97.2 /100 | #85 | Exceptional 10.1% |
| Romanians | 97.2 /100 | #86 | Exceptional 10.1% |
| Burmese | 97.2 /100 | #87 | Exceptional 10.1% |
| Jordanians | 97.1 /100 | #88 | Exceptional 10.1% |
| Immigrants | Bulgaria | 97.0 /100 | #89 | Exceptional 10.1% |
| Ukrainians | 96.9 /100 | #90 | Exceptional 10.1% |
| Puget Sound Salish | 96.9 /100 | #91 | Exceptional 10.1% |
| Immigrants | Singapore | 96.9 /100 | #92 | Exceptional 10.1% |
| Immigrants | Sweden | 96.7 /100 | #93 | Exceptional 10.1% |
| Immigrants | Germany | 96.7 /100 | #94 | Exceptional 10.1% |
| Immigrants | Japan | 96.3 /100 | #95 | Exceptional 10.1% |
| Basques | 95.9 /100 | #96 | Exceptional 10.2% |
Demographics Similar to Hondurans by Seniors Poverty Over the Age of 65
In terms of seniors poverty over the age of 65, the demographic groups most similar to Hondurans are Trinidadian and Tobagonian (14.2%, a difference of 0.10%), Immigrants from West Indies (14.2%, a difference of 0.17%), Bahamian (14.2%, a difference of 0.26%), Native/Alaskan (14.2%, a difference of 0.27%), and Immigrants from Latin America (14.2%, a difference of 0.31%).
| Demographics | Rating | Rank | Seniors Poverty Over the Age of 65 |
| Yup'ik | 0.0 /100 | #302 | Tragic 14.1% |
| Immigrants | Bangladesh | 0.0 /100 | #303 | Tragic 14.1% |
| West Indians | 0.0 /100 | #304 | Tragic 14.1% |
| Immigrants | Trinidad and Tobago | 0.0 /100 | #305 | Tragic 14.1% |
| Immigrants | Latin America | 0.0 /100 | #306 | Tragic 14.2% |
| Immigrants | West Indies | 0.0 /100 | #307 | Tragic 14.2% |
| Trinidadians and Tobagonians | 0.0 /100 | #308 | Tragic 14.2% |
| Hondurans | 0.0 /100 | #309 | Tragic 14.2% |
| Bahamians | 0.0 /100 | #310 | Tragic 14.2% |
| Natives/Alaskans | 0.0 /100 | #311 | Tragic 14.2% |
| Hispanics or Latinos | 0.0 /100 | #312 | Tragic 14.3% |
| Barbadians | 0.0 /100 | #313 | Tragic 14.4% |
| Guyanese | 0.0 /100 | #314 | Tragic 14.4% |
| Immigrants | Ecuador | 0.0 /100 | #315 | Tragic 14.4% |
| Immigrants | Guyana | 0.0 /100 | #316 | Tragic 14.5% |