Serbian vs Immigrants from Bahamas Seniors Poverty Over the Age of 65
COMPARE
Serbian
Immigrants from Bahamas
Seniors Poverty Over the Age of 65
Seniors Poverty Over the Age of 65 Comparison
Serbians
Immigrants from Bahamas
9.8%
SENIORS POVERTY OVER THE AGE OF 65
99.1/ 100
METRIC RATING
58th/ 347
METRIC RANK
13.0%
SENIORS POVERTY OVER THE AGE OF 65
0.0/ 100
METRIC RATING
278th/ 347
METRIC RANK
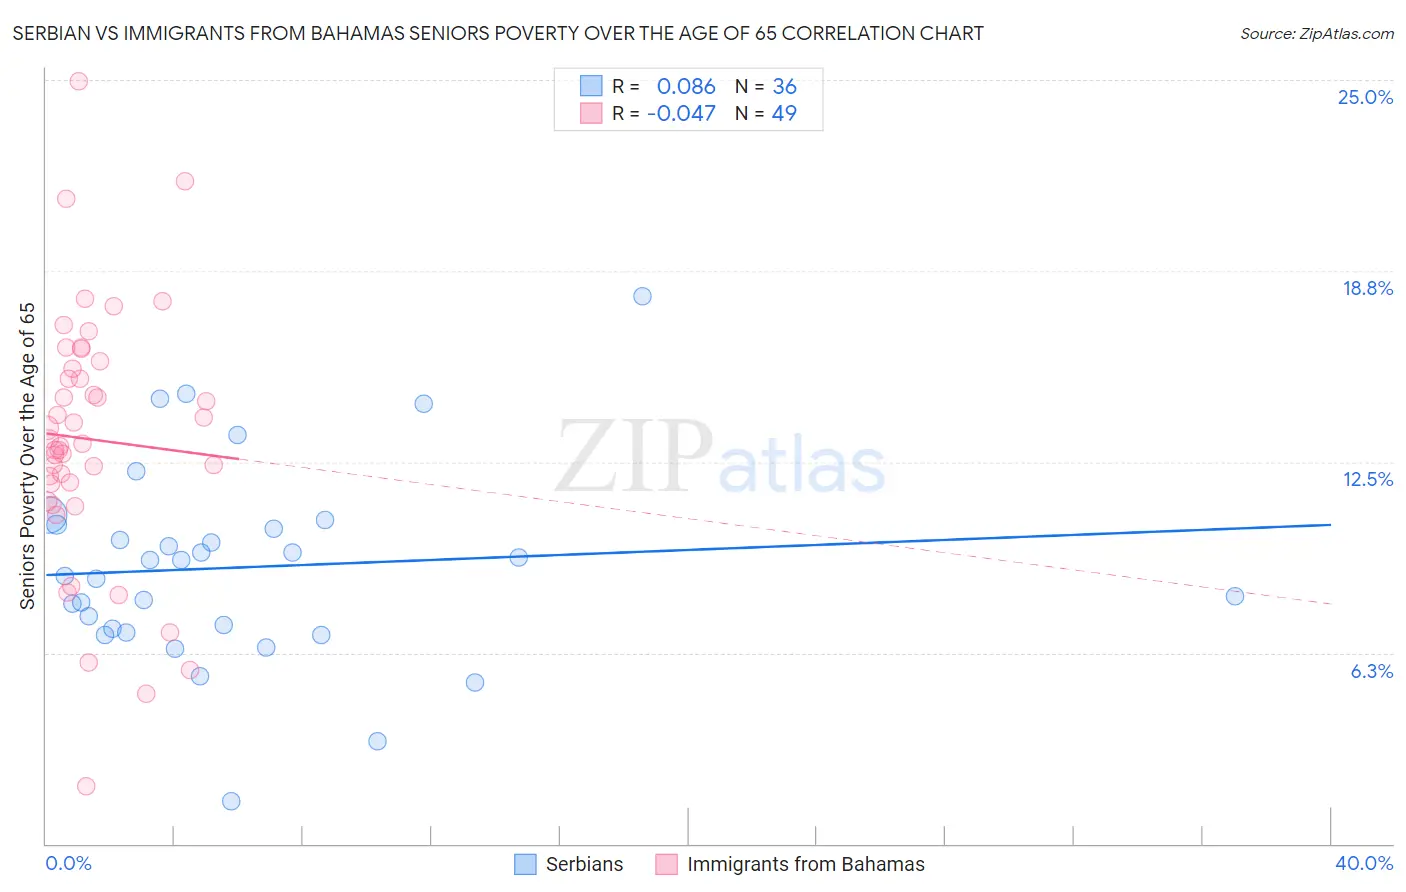
Serbian vs Immigrants from Bahamas Seniors Poverty Over the Age of 65 Correlation Chart
The statistical analysis conducted on geographies consisting of 267,079,314 people shows a slight positive correlation between the proportion of Serbians and poverty level among seniors over the age of 65 in the United States with a correlation coefficient (R) of 0.086 and weighted average of 9.8%. Similarly, the statistical analysis conducted on geographies consisting of 104,576,826 people shows no correlation between the proportion of Immigrants from Bahamas and poverty level among seniors over the age of 65 in the United States with a correlation coefficient (R) of -0.047 and weighted average of 13.0%, a difference of 33.1%.
Seniors Poverty Over the Age of 65 Correlation Summary
| Measurement | Serbian | Immigrants from Bahamas |
| Minimum | 1.4% | 1.9% |
| Maximum | 17.9% | 24.9% |
| Range | 16.5% | 23.1% |
| Mean | 9.0% | 13.2% |
| Median | 9.0% | 13.1% |
| Interquartile 25% (IQ1) | 7.0% | 11.5% |
| Interquartile 75% (IQ3) | 10.4% | 15.7% |
| Interquartile Range (IQR) | 3.4% | 4.2% |
| Standard Deviation (Sample) | 3.3% | 4.2% |
| Standard Deviation (Population) | 3.2% | 4.2% |
Similar Demographics by Seniors Poverty Over the Age of 65
Demographics Similar to Serbians by Seniors Poverty Over the Age of 65
In terms of seniors poverty over the age of 65, the demographic groups most similar to Serbians are Bolivian (9.8%, a difference of 0.060%), Immigrants from Canada (9.8%, a difference of 0.15%), Celtic (9.8%, a difference of 0.18%), Immigrants from England (9.8%, a difference of 0.19%), and Iranian (9.8%, a difference of 0.27%).
| Demographics | Rating | Rank | Seniors Poverty Over the Age of 65 |
| Carpatho Rusyns | 99.3 /100 | #51 | Exceptional 9.7% |
| Filipinos | 99.3 /100 | #52 | Exceptional 9.7% |
| Slavs | 99.2 /100 | #53 | Exceptional 9.8% |
| Immigrants | Northern Europe | 99.2 /100 | #54 | Exceptional 9.8% |
| Afghans | 99.2 /100 | #55 | Exceptional 9.8% |
| Immigrants | England | 99.1 /100 | #56 | Exceptional 9.8% |
| Bolivians | 99.1 /100 | #57 | Exceptional 9.8% |
| Serbians | 99.1 /100 | #58 | Exceptional 9.8% |
| Immigrants | Canada | 99.0 /100 | #59 | Exceptional 9.8% |
| Celtics | 99.0 /100 | #60 | Exceptional 9.8% |
| Iranians | 98.9 /100 | #61 | Exceptional 9.8% |
| French Canadians | 98.9 /100 | #62 | Exceptional 9.8% |
| Macedonians | 98.8 /100 | #63 | Exceptional 9.9% |
| Immigrants | North America | 98.8 /100 | #64 | Exceptional 9.9% |
| Pennsylvania Germans | 98.7 /100 | #65 | Exceptional 9.9% |
Demographics Similar to Immigrants from Bahamas by Seniors Poverty Over the Age of 65
In terms of seniors poverty over the age of 65, the demographic groups most similar to Immigrants from Bahamas are Mexican (13.1%, a difference of 0.16%), Yuman (13.1%, a difference of 0.20%), Immigrants from El Salvador (13.1%, a difference of 0.64%), Paiute (12.9%, a difference of 0.83%), and Immigrants from the Azores (12.9%, a difference of 0.92%).
| Demographics | Rating | Rank | Seniors Poverty Over the Age of 65 |
| Immigrants | Ghana | 0.1 /100 | #271 | Tragic 12.8% |
| Immigrants | Uruguay | 0.1 /100 | #272 | Tragic 12.8% |
| Kiowa | 0.0 /100 | #273 | Tragic 12.8% |
| Salvadorans | 0.0 /100 | #274 | Tragic 12.8% |
| Immigrants | Colombia | 0.0 /100 | #275 | Tragic 12.9% |
| Immigrants | Azores | 0.0 /100 | #276 | Tragic 12.9% |
| Paiute | 0.0 /100 | #277 | Tragic 12.9% |
| Immigrants | Bahamas | 0.0 /100 | #278 | Tragic 13.0% |
| Mexicans | 0.0 /100 | #279 | Tragic 13.1% |
| Yuman | 0.0 /100 | #280 | Tragic 13.1% |
| Immigrants | El Salvador | 0.0 /100 | #281 | Tragic 13.1% |
| Senegalese | 0.0 /100 | #282 | Tragic 13.3% |
| Central Americans | 0.0 /100 | #283 | Tragic 13.4% |
| Colville | 0.0 /100 | #284 | Tragic 13.5% |
| Guatemalans | 0.0 /100 | #285 | Tragic 13.5% |