Serbian vs Immigrants from Bahamas Single Mother Households
COMPARE
Serbian
Immigrants from Bahamas
Single Mother Households
Single Mother Households Comparison
Serbians
Immigrants from Bahamas
5.7%
SINGLE MOTHER HOUSEHOLDS
96.7/ 100
METRIC RATING
93rd/ 347
METRIC RANK
8.0%
SINGLE MOTHER HOUSEHOLDS
0.0/ 100
METRIC RATING
303rd/ 347
METRIC RANK
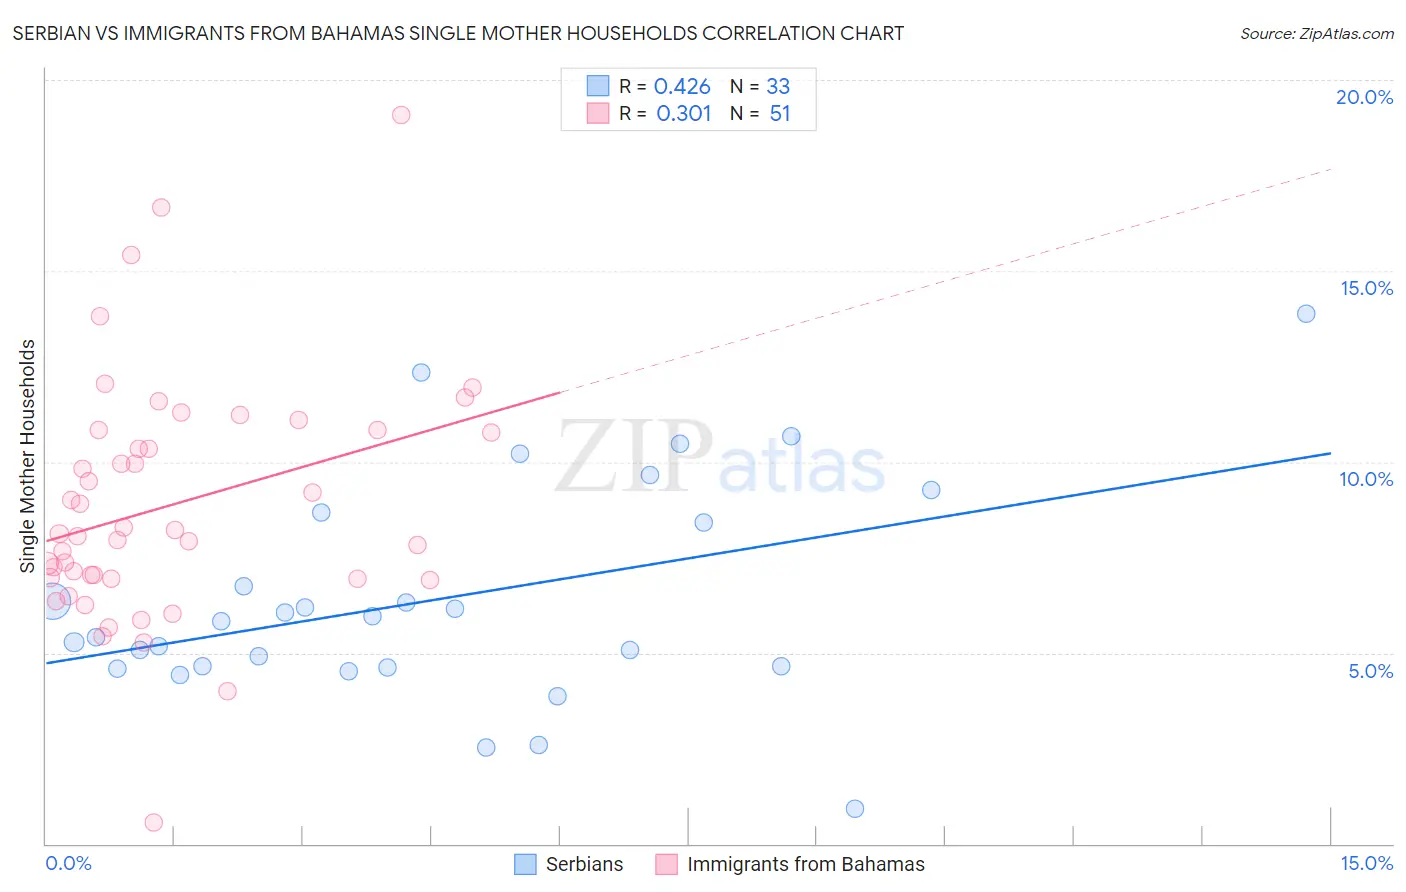
Serbian vs Immigrants from Bahamas Single Mother Households Correlation Chart
The statistical analysis conducted on geographies consisting of 266,907,354 people shows a moderate positive correlation between the proportion of Serbians and percentage of single mother households in the United States with a correlation coefficient (R) of 0.426 and weighted average of 5.7%. Similarly, the statistical analysis conducted on geographies consisting of 104,574,907 people shows a mild positive correlation between the proportion of Immigrants from Bahamas and percentage of single mother households in the United States with a correlation coefficient (R) of 0.301 and weighted average of 8.0%, a difference of 39.4%.
Single Mother Households Correlation Summary
| Measurement | Serbian | Immigrants from Bahamas |
| Minimum | 0.92% | 0.57% |
| Maximum | 13.9% | 19.1% |
| Range | 13.0% | 18.5% |
| Mean | 6.4% | 8.9% |
| Median | 5.8% | 8.1% |
| Interquartile 25% (IQ1) | 4.6% | 6.9% |
| Interquartile 75% (IQ3) | 8.5% | 10.8% |
| Interquartile Range (IQR) | 3.9% | 3.9% |
| Standard Deviation (Sample) | 2.9% | 3.2% |
| Standard Deviation (Population) | 2.8% | 3.1% |
Similar Demographics by Single Mother Households
Demographics Similar to Serbians by Single Mother Households
In terms of single mother households, the demographic groups most similar to Serbians are Immigrants from Western Asia (5.7%, a difference of 0.010%), Basque (5.7%, a difference of 0.050%), Slovak (5.7%, a difference of 0.11%), European (5.7%, a difference of 0.24%), and Austrian (5.7%, a difference of 0.26%).
| Demographics | Rating | Rank | Single Mother Households |
| Finns | 97.6 /100 | #86 | Exceptional 5.7% |
| Immigrants | Turkey | 97.5 /100 | #87 | Exceptional 5.7% |
| Israelis | 97.4 /100 | #88 | Exceptional 5.7% |
| Ukrainians | 97.2 /100 | #89 | Exceptional 5.7% |
| Immigrants | Indonesia | 97.2 /100 | #90 | Exceptional 5.7% |
| Europeans | 97.0 /100 | #91 | Exceptional 5.7% |
| Immigrants | Western Asia | 96.7 /100 | #92 | Exceptional 5.7% |
| Serbians | 96.7 /100 | #93 | Exceptional 5.7% |
| Basques | 96.7 /100 | #94 | Exceptional 5.7% |
| Slovaks | 96.6 /100 | #95 | Exceptional 5.7% |
| Austrians | 96.4 /100 | #96 | Exceptional 5.7% |
| Tlingit-Haida | 96.4 /100 | #97 | Exceptional 5.7% |
| Immigrants | South Africa | 96.3 /100 | #98 | Exceptional 5.7% |
| Immigrants | Poland | 96.3 /100 | #99 | Exceptional 5.8% |
| Scandinavians | 96.2 /100 | #100 | Exceptional 5.8% |
Demographics Similar to Immigrants from Bahamas by Single Mother Households
In terms of single mother households, the demographic groups most similar to Immigrants from Bahamas are Immigrants from Ghana (8.0%, a difference of 0.020%), Chippewa (8.0%, a difference of 0.12%), Mexican (8.0%, a difference of 0.27%), Native/Alaskan (8.0%, a difference of 0.44%), and Colville (8.0%, a difference of 0.49%).
| Demographics | Rating | Rank | Single Mother Households |
| Immigrants | Latin America | 0.0 /100 | #296 | Tragic 7.9% |
| Hispanics or Latinos | 0.0 /100 | #297 | Tragic 7.9% |
| Immigrants | West Indies | 0.0 /100 | #298 | Tragic 7.9% |
| Houma | 0.0 /100 | #299 | Tragic 7.9% |
| Mexicans | 0.0 /100 | #300 | Tragic 8.0% |
| Chippewa | 0.0 /100 | #301 | Tragic 8.0% |
| Immigrants | Ghana | 0.0 /100 | #302 | Tragic 8.0% |
| Immigrants | Bahamas | 0.0 /100 | #303 | Tragic 8.0% |
| Natives/Alaskans | 0.0 /100 | #304 | Tragic 8.0% |
| Colville | 0.0 /100 | #305 | Tragic 8.0% |
| Immigrants | Barbados | 0.0 /100 | #306 | Tragic 8.0% |
| Immigrants | St. Vincent and the Grenadines | 0.0 /100 | #307 | Tragic 8.0% |
| Immigrants | Central America | 0.0 /100 | #308 | Tragic 8.1% |
| Cheyenne | 0.0 /100 | #309 | Tragic 8.1% |
| Hondurans | 0.0 /100 | #310 | Tragic 8.1% |