Serbian vs Immigrants from France Seniors Poverty Over the Age of 65
COMPARE
Serbian
Immigrants from France
Seniors Poverty Over the Age of 65
Seniors Poverty Over the Age of 65 Comparison
Serbians
Immigrants from France
9.8%
SENIORS POVERTY OVER THE AGE OF 65
99.1/ 100
METRIC RATING
58th/ 347
METRIC RANK
11.0%
SENIORS POVERTY OVER THE AGE OF 65
40.9/ 100
METRIC RATING
184th/ 347
METRIC RANK
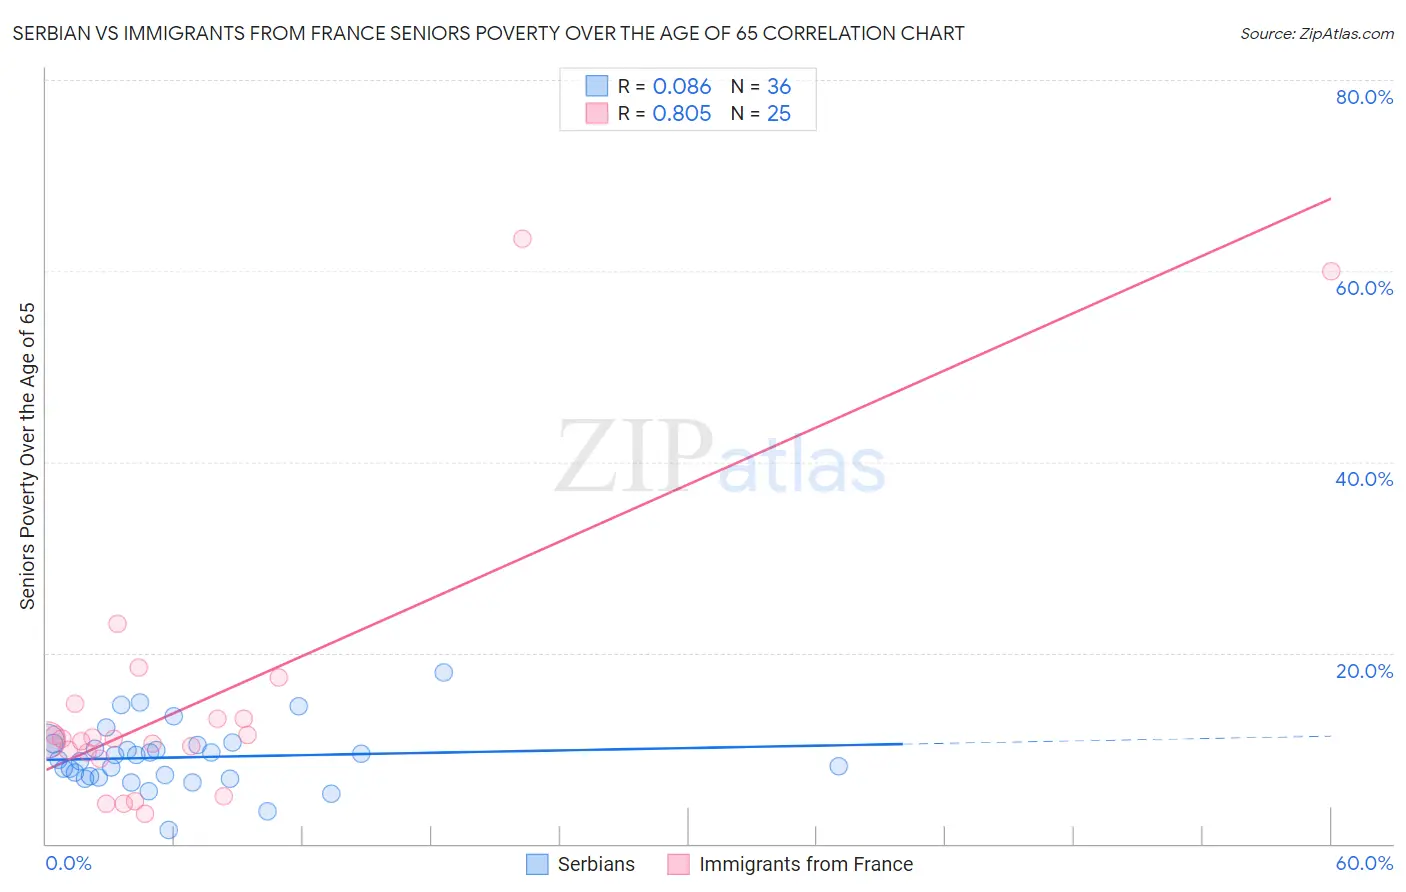
Serbian vs Immigrants from France Seniors Poverty Over the Age of 65 Correlation Chart
The statistical analysis conducted on geographies consisting of 267,079,314 people shows a slight positive correlation between the proportion of Serbians and poverty level among seniors over the age of 65 in the United States with a correlation coefficient (R) of 0.086 and weighted average of 9.8%. Similarly, the statistical analysis conducted on geographies consisting of 287,379,710 people shows a very strong positive correlation between the proportion of Immigrants from France and poverty level among seniors over the age of 65 in the United States with a correlation coefficient (R) of 0.805 and weighted average of 11.0%, a difference of 12.4%.
Seniors Poverty Over the Age of 65 Correlation Summary
| Measurement | Serbian | Immigrants from France |
| Minimum | 1.4% | 3.1% |
| Maximum | 17.9% | 63.4% |
| Range | 16.5% | 60.3% |
| Mean | 9.0% | 14.8% |
| Median | 9.0% | 11.0% |
| Interquartile 25% (IQ1) | 7.0% | 9.2% |
| Interquartile 75% (IQ3) | 10.4% | 13.9% |
| Interquartile Range (IQR) | 3.4% | 4.7% |
| Standard Deviation (Sample) | 3.3% | 14.8% |
| Standard Deviation (Population) | 3.2% | 14.5% |
Similar Demographics by Seniors Poverty Over the Age of 65
Demographics Similar to Serbians by Seniors Poverty Over the Age of 65
In terms of seniors poverty over the age of 65, the demographic groups most similar to Serbians are Bolivian (9.8%, a difference of 0.060%), Immigrants from Canada (9.8%, a difference of 0.15%), Celtic (9.8%, a difference of 0.18%), Immigrants from England (9.8%, a difference of 0.19%), and Iranian (9.8%, a difference of 0.27%).
| Demographics | Rating | Rank | Seniors Poverty Over the Age of 65 |
| Carpatho Rusyns | 99.3 /100 | #51 | Exceptional 9.7% |
| Filipinos | 99.3 /100 | #52 | Exceptional 9.7% |
| Slavs | 99.2 /100 | #53 | Exceptional 9.8% |
| Immigrants | Northern Europe | 99.2 /100 | #54 | Exceptional 9.8% |
| Afghans | 99.2 /100 | #55 | Exceptional 9.8% |
| Immigrants | England | 99.1 /100 | #56 | Exceptional 9.8% |
| Bolivians | 99.1 /100 | #57 | Exceptional 9.8% |
| Serbians | 99.1 /100 | #58 | Exceptional 9.8% |
| Immigrants | Canada | 99.0 /100 | #59 | Exceptional 9.8% |
| Celtics | 99.0 /100 | #60 | Exceptional 9.8% |
| Iranians | 98.9 /100 | #61 | Exceptional 9.8% |
| French Canadians | 98.9 /100 | #62 | Exceptional 9.8% |
| Macedonians | 98.8 /100 | #63 | Exceptional 9.9% |
| Immigrants | North America | 98.8 /100 | #64 | Exceptional 9.9% |
| Pennsylvania Germans | 98.7 /100 | #65 | Exceptional 9.9% |
Demographics Similar to Immigrants from France by Seniors Poverty Over the Age of 65
In terms of seniors poverty over the age of 65, the demographic groups most similar to Immigrants from France are Immigrants from Kazakhstan (11.0%, a difference of 0.010%), Immigrants from Fiji (11.0%, a difference of 0.10%), Immigrants from Thailand (11.0%, a difference of 0.23%), Immigrants from Eastern Africa (11.0%, a difference of 0.23%), and Immigrants from Lebanon (11.1%, a difference of 0.25%).
| Demographics | Rating | Rank | Seniors Poverty Over the Age of 65 |
| Cherokee | 47.3 /100 | #177 | Average 11.0% |
| German Russians | 46.9 /100 | #178 | Average 11.0% |
| Immigrants | Northern Africa | 44.6 /100 | #179 | Average 11.0% |
| Immigrants | Thailand | 43.5 /100 | #180 | Average 11.0% |
| Immigrants | Eastern Africa | 43.4 /100 | #181 | Average 11.0% |
| Immigrants | Fiji | 42.0 /100 | #182 | Average 11.0% |
| Immigrants | Kazakhstan | 41.0 /100 | #183 | Average 11.0% |
| Immigrants | France | 40.9 /100 | #184 | Average 11.0% |
| Immigrants | Lebanon | 38.2 /100 | #185 | Fair 11.1% |
| Immigrants | Eastern Asia | 37.5 /100 | #186 | Fair 11.1% |
| Immigrants | Middle Africa | 37.4 /100 | #187 | Fair 11.1% |
| Immigrants | Hong Kong | 36.3 /100 | #188 | Fair 11.1% |
| Immigrants | Laos | 35.7 /100 | #189 | Fair 11.1% |
| Indians (Asian) | 34.2 /100 | #190 | Fair 11.1% |
| Immigrants | Uganda | 32.2 /100 | #191 | Fair 11.1% |