Immigrants from Pakistan vs Belgian Single Father Poverty
COMPARE
Immigrants from Pakistan
Belgian
Single Father Poverty
Single Father Poverty Comparison
Immigrants from Pakistan
Belgians
15.0%
SINGLE FATHER POVERTY
99.9/ 100
METRIC RATING
51st/ 347
METRIC RANK
16.8%
SINGLE FATHER POVERTY
5.3/ 100
METRIC RATING
228th/ 347
METRIC RANK
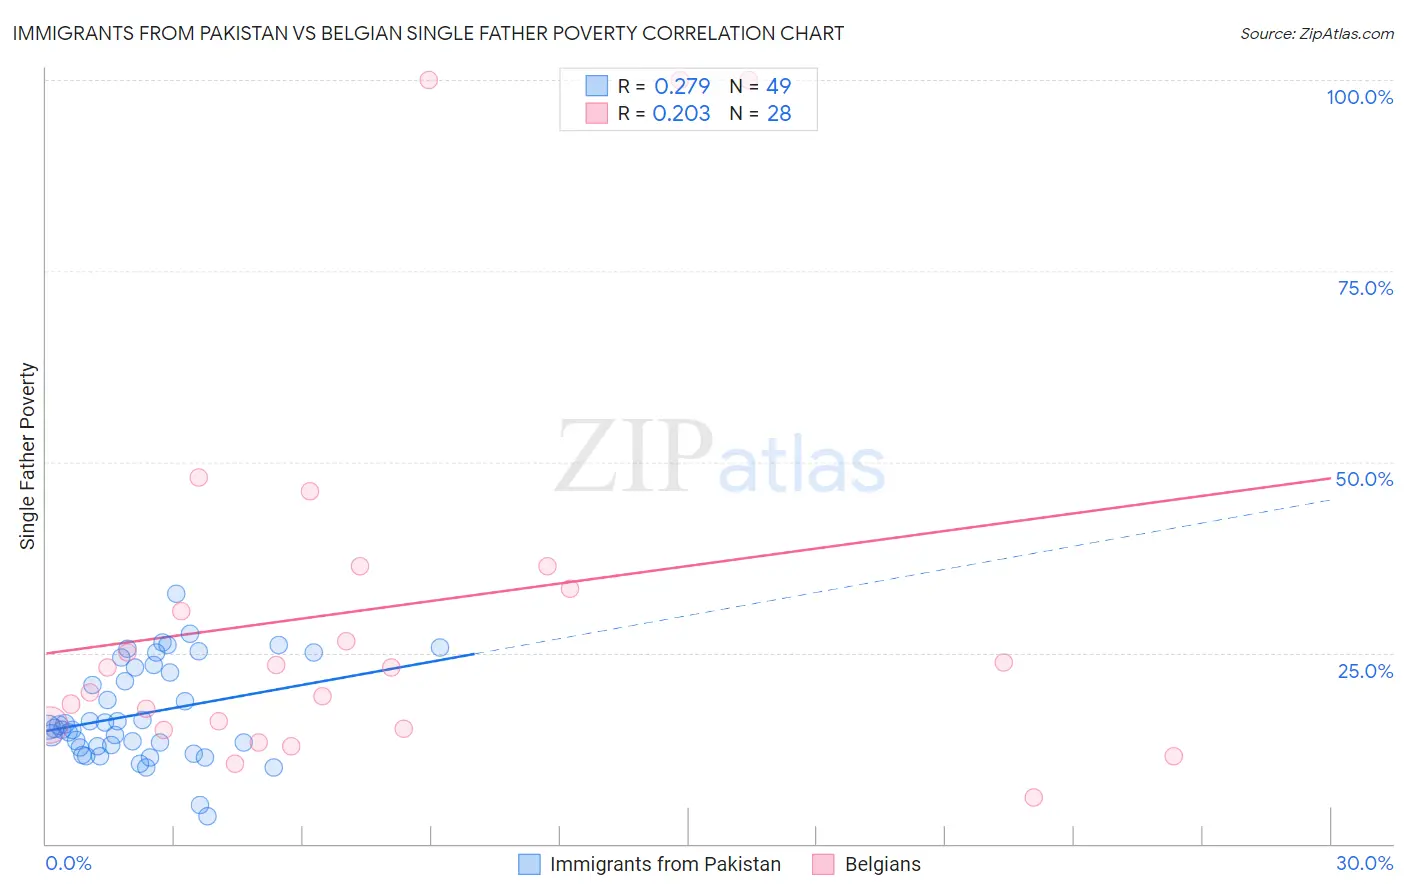
Immigrants from Pakistan vs Belgian Single Father Poverty Correlation Chart
The statistical analysis conducted on geographies consisting of 230,495,703 people shows a weak positive correlation between the proportion of Immigrants from Pakistan and poverty level among single fathers in the United States with a correlation coefficient (R) of 0.279 and weighted average of 15.0%. Similarly, the statistical analysis conducted on geographies consisting of 276,929,411 people shows a weak positive correlation between the proportion of Belgians and poverty level among single fathers in the United States with a correlation coefficient (R) of 0.203 and weighted average of 16.8%, a difference of 12.3%.
Single Father Poverty Correlation Summary
| Measurement | Immigrants from Pakistan | Belgian |
| Minimum | 3.7% | 6.1% |
| Maximum | 32.8% | 100.0% |
| Range | 29.1% | 93.9% |
| Mean | 17.1% | 30.9% |
| Median | 15.2% | 23.0% |
| Interquartile 25% (IQ1) | 12.7% | 15.3% |
| Interquartile 75% (IQ3) | 23.2% | 34.8% |
| Interquartile Range (IQR) | 10.5% | 19.6% |
| Standard Deviation (Sample) | 6.4% | 26.4% |
| Standard Deviation (Population) | 6.3% | 25.9% |
Similar Demographics by Single Father Poverty
Demographics Similar to Immigrants from Pakistan by Single Father Poverty
In terms of single father poverty, the demographic groups most similar to Immigrants from Pakistan are Bhutanese (15.0%, a difference of 0.020%), Immigrants from El Salvador (15.0%, a difference of 0.040%), Immigrants from Eastern Asia (15.0%, a difference of 0.070%), Immigrants from Kenya (15.0%, a difference of 0.070%), and Immigrants from China (14.9%, a difference of 0.23%).
| Demographics | Rating | Rank | Single Father Poverty |
| Salvadorans | 100.0 /100 | #44 | Exceptional 14.9% |
| Immigrants | Somalia | 100.0 /100 | #45 | Exceptional 14.9% |
| Immigrants | Cambodia | 99.9 /100 | #46 | Exceptional 14.9% |
| Immigrants | China | 99.9 /100 | #47 | Exceptional 14.9% |
| Malaysians | 99.9 /100 | #48 | Exceptional 14.9% |
| Immigrants | Eastern Asia | 99.9 /100 | #49 | Exceptional 15.0% |
| Bhutanese | 99.9 /100 | #50 | Exceptional 15.0% |
| Immigrants | Pakistan | 99.9 /100 | #51 | Exceptional 15.0% |
| Immigrants | El Salvador | 99.9 /100 | #52 | Exceptional 15.0% |
| Immigrants | Kenya | 99.9 /100 | #53 | Exceptional 15.0% |
| Immigrants | Uzbekistan | 99.9 /100 | #54 | Exceptional 15.0% |
| Immigrants | Bulgaria | 99.9 /100 | #55 | Exceptional 15.0% |
| Immigrants | Laos | 99.9 /100 | #56 | Exceptional 15.1% |
| Laotians | 99.9 /100 | #57 | Exceptional 15.1% |
| Hawaiians | 99.9 /100 | #58 | Exceptional 15.1% |
Demographics Similar to Belgians by Single Father Poverty
In terms of single father poverty, the demographic groups most similar to Belgians are British (16.8%, a difference of 0.070%), Hispanic or Latino (16.8%, a difference of 0.16%), Israeli (16.8%, a difference of 0.16%), Immigrants from Trinidad and Tobago (16.8%, a difference of 0.19%), and Menominee (16.8%, a difference of 0.21%).
| Demographics | Rating | Rank | Single Father Poverty |
| Immigrants | Greece | 8.1 /100 | #221 | Tragic 16.7% |
| Immigrants | Spain | 8.0 /100 | #222 | Tragic 16.7% |
| Immigrants | Austria | 7.0 /100 | #223 | Tragic 16.8% |
| Immigrants | Norway | 6.5 /100 | #224 | Tragic 16.8% |
| Menominee | 6.4 /100 | #225 | Tragic 16.8% |
| Hispanics or Latinos | 6.1 /100 | #226 | Tragic 16.8% |
| British | 5.6 /100 | #227 | Tragic 16.8% |
| Belgians | 5.3 /100 | #228 | Tragic 16.8% |
| Israelis | 4.6 /100 | #229 | Tragic 16.8% |
| Immigrants | Trinidad and Tobago | 4.5 /100 | #230 | Tragic 16.8% |
| Spanish Americans | 3.7 /100 | #231 | Tragic 16.9% |
| Immigrants | Grenada | 3.7 /100 | #232 | Tragic 16.9% |
| Senegalese | 3.2 /100 | #233 | Tragic 16.9% |
| Marshallese | 3.1 /100 | #234 | Tragic 16.9% |
| Immigrants | Western Europe | 2.9 /100 | #235 | Tragic 16.9% |