Seminole vs Immigrants from South Central Asia Family Poverty
COMPARE
Seminole
Immigrants from South Central Asia
Family Poverty
Family Poverty Comparison
Seminole
Immigrants from South Central Asia
11.9%
FAMILY POVERTY
0.0/ 100
METRIC RATING
308th/ 347
METRIC RANK
7.2%
FAMILY POVERTY
99.8/ 100
METRIC RATING
16th/ 347
METRIC RANK
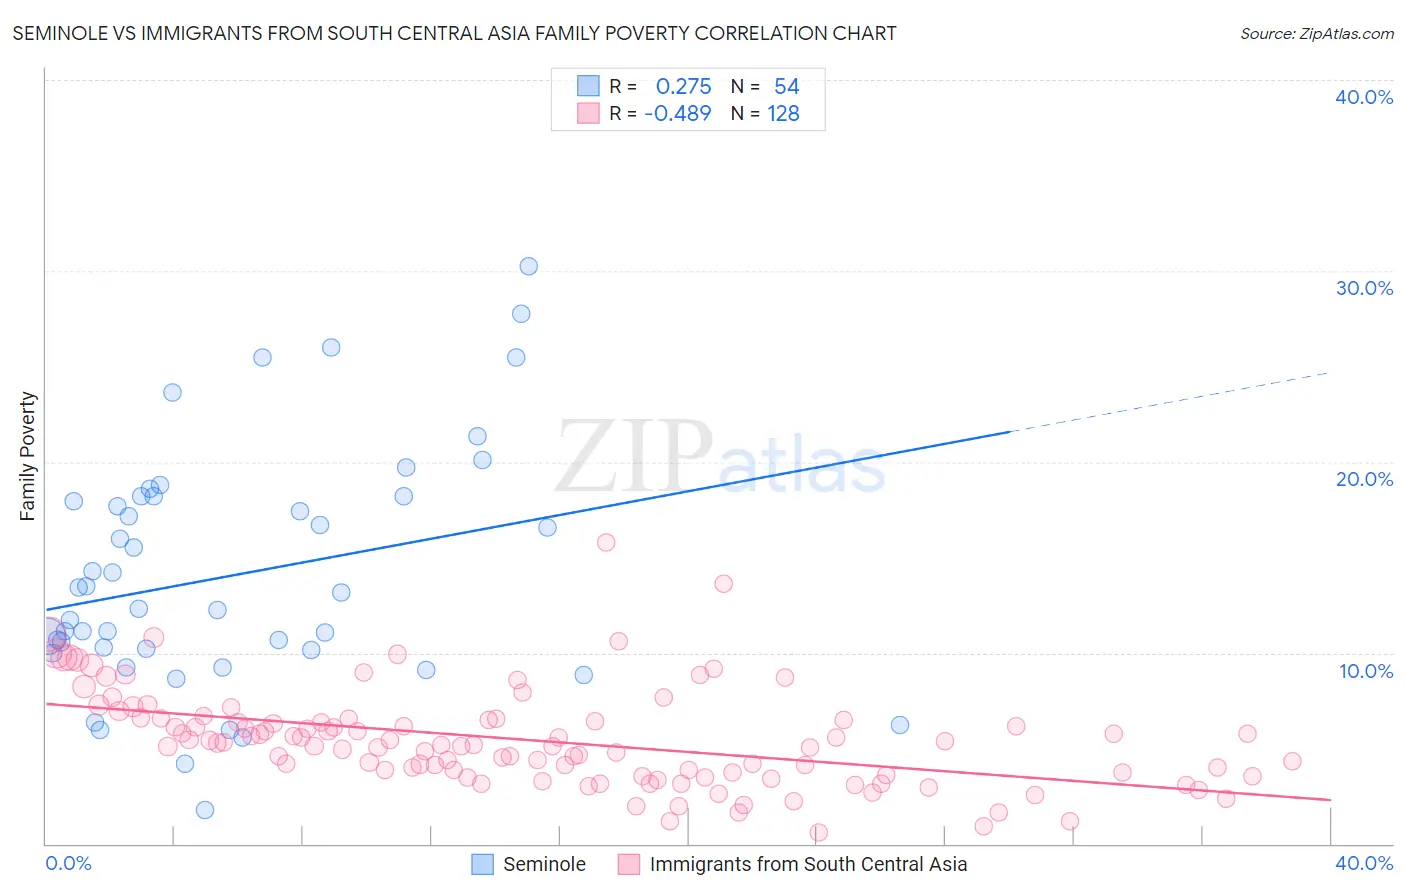
Seminole vs Immigrants from South Central Asia Family Poverty Correlation Chart
The statistical analysis conducted on geographies consisting of 118,266,338 people shows a weak positive correlation between the proportion of Seminole and poverty level among families in the United States with a correlation coefficient (R) of 0.275 and weighted average of 11.9%. Similarly, the statistical analysis conducted on geographies consisting of 471,025,257 people shows a moderate negative correlation between the proportion of Immigrants from South Central Asia and poverty level among families in the United States with a correlation coefficient (R) of -0.489 and weighted average of 7.2%, a difference of 65.2%.
Family Poverty Correlation Summary
| Measurement | Seminole | Immigrants from South Central Asia |
| Minimum | 1.8% | 0.60% |
| Maximum | 30.2% | 15.8% |
| Range | 28.4% | 15.2% |
| Mean | 14.1% | 5.4% |
| Median | 12.7% | 5.2% |
| Interquartile 25% (IQ1) | 10.1% | 3.7% |
| Interquartile 75% (IQ3) | 18.2% | 6.5% |
| Interquartile Range (IQR) | 8.0% | 2.9% |
| Standard Deviation (Sample) | 6.3% | 2.5% |
| Standard Deviation (Population) | 6.2% | 2.5% |
Similar Demographics by Family Poverty
Demographics Similar to Seminole by Family Poverty
In terms of family poverty, the demographic groups most similar to Seminole are Immigrants from Congo (11.9%, a difference of 0.060%), Cajun (11.9%, a difference of 0.17%), Hispanic or Latino (12.0%, a difference of 0.45%), Immigrants from Guatemala (12.0%, a difference of 0.45%), and Mexican (11.8%, a difference of 0.73%).
| Demographics | Rating | Rank | Family Poverty |
| Bahamians | 0.0 /100 | #301 | Tragic 11.7% |
| Guatemalans | 0.0 /100 | #302 | Tragic 11.7% |
| Africans | 0.0 /100 | #303 | Tragic 11.8% |
| Immigrants | Latin America | 0.0 /100 | #304 | Tragic 11.8% |
| Mexicans | 0.0 /100 | #305 | Tragic 11.8% |
| Cajuns | 0.0 /100 | #306 | Tragic 11.9% |
| Immigrants | Congo | 0.0 /100 | #307 | Tragic 11.9% |
| Seminole | 0.0 /100 | #308 | Tragic 11.9% |
| Hispanics or Latinos | 0.0 /100 | #309 | Tragic 12.0% |
| Immigrants | Guatemala | 0.0 /100 | #310 | Tragic 12.0% |
| Ute | 0.0 /100 | #311 | Tragic 12.1% |
| Immigrants | Central America | 0.0 /100 | #312 | Tragic 12.1% |
| Immigrants | Caribbean | 0.0 /100 | #313 | Tragic 12.2% |
| Kiowa | 0.0 /100 | #314 | Tragic 12.2% |
| Immigrants | Mexico | 0.0 /100 | #315 | Tragic 12.3% |
Demographics Similar to Immigrants from South Central Asia by Family Poverty
In terms of family poverty, the demographic groups most similar to Immigrants from South Central Asia are Luxembourger (7.2%, a difference of 0.22%), Immigrants from Lithuania (7.2%, a difference of 0.24%), Lithuanian (7.2%, a difference of 0.27%), Eastern European (7.2%, a difference of 0.54%), and Immigrants from Hong Kong (7.3%, a difference of 0.70%).
| Demographics | Rating | Rank | Family Poverty |
| Latvians | 99.9 /100 | #9 | Exceptional 7.1% |
| Bulgarians | 99.8 /100 | #10 | Exceptional 7.1% |
| Immigrants | Singapore | 99.8 /100 | #11 | Exceptional 7.1% |
| Maltese | 99.8 /100 | #12 | Exceptional 7.1% |
| Swedes | 99.8 /100 | #13 | Exceptional 7.1% |
| Iranians | 99.8 /100 | #14 | Exceptional 7.1% |
| Lithuanians | 99.8 /100 | #15 | Exceptional 7.2% |
| Immigrants | South Central Asia | 99.8 /100 | #16 | Exceptional 7.2% |
| Luxembourgers | 99.8 /100 | #17 | Exceptional 7.2% |
| Immigrants | Lithuania | 99.8 /100 | #18 | Exceptional 7.2% |
| Eastern Europeans | 99.7 /100 | #19 | Exceptional 7.2% |
| Immigrants | Hong Kong | 99.7 /100 | #20 | Exceptional 7.3% |
| Immigrants | Iran | 99.7 /100 | #21 | Exceptional 7.3% |
| Danes | 99.7 /100 | #22 | Exceptional 7.3% |
| Assyrians/Chaldeans/Syriacs | 99.7 /100 | #23 | Exceptional 7.3% |