Assyrian/Chaldean/Syriac vs American Male Poverty
COMPARE
Assyrian/Chaldean/Syriac
American
Male Poverty
Male Poverty Comparison
Assyrians/Chaldeans/Syriacs
Americans
9.1%
MALE POVERTY
99.9/ 100
METRIC RATING
6th/ 347
METRIC RANK
12.1%
MALE POVERTY
3.2/ 100
METRIC RATING
212th/ 347
METRIC RANK
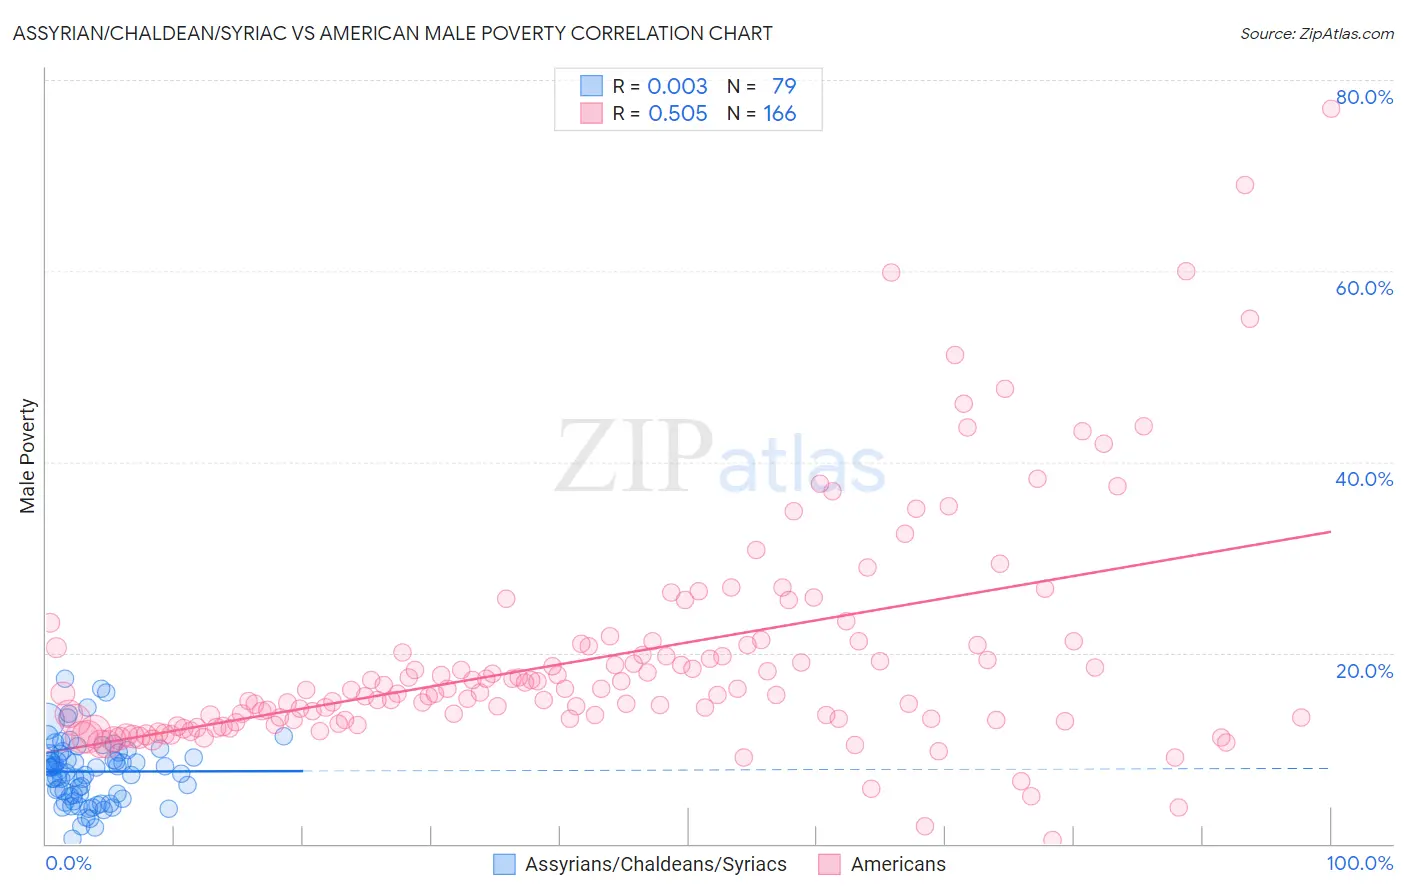
Assyrian/Chaldean/Syriac vs American Male Poverty Correlation Chart
The statistical analysis conducted on geographies consisting of 110,288,408 people shows no correlation between the proportion of Assyrians/Chaldeans/Syriacs and poverty level among males in the United States with a correlation coefficient (R) of 0.003 and weighted average of 9.1%. Similarly, the statistical analysis conducted on geographies consisting of 579,982,816 people shows a substantial positive correlation between the proportion of Americans and poverty level among males in the United States with a correlation coefficient (R) of 0.505 and weighted average of 12.1%, a difference of 32.8%.
Male Poverty Correlation Summary
| Measurement | Assyrian/Chaldean/Syriac | American |
| Minimum | 0.52% | 0.36% |
| Maximum | 17.3% | 77.0% |
| Range | 16.8% | 76.7% |
| Mean | 7.6% | 19.4% |
| Median | 7.6% | 15.8% |
| Interquartile 25% (IQ1) | 4.9% | 12.9% |
| Interquartile 75% (IQ3) | 9.4% | 20.8% |
| Interquartile Range (IQR) | 4.5% | 7.9% |
| Standard Deviation (Sample) | 3.4% | 11.9% |
| Standard Deviation (Population) | 3.4% | 11.8% |
Similar Demographics by Male Poverty
Demographics Similar to Assyrians/Chaldeans/Syriacs by Male Poverty
In terms of male poverty, the demographic groups most similar to Assyrians/Chaldeans/Syriacs are Immigrants from Ireland (9.1%, a difference of 0.080%), Maltese (9.1%, a difference of 0.66%), Filipino (9.2%, a difference of 0.75%), Immigrants from South Central Asia (9.3%, a difference of 1.5%), and Bulgarian (9.3%, a difference of 2.1%).
| Demographics | Rating | Rank | Male Poverty |
| Immigrants | India | 100.0 /100 | #1 | Exceptional 8.2% |
| Chinese | 100.0 /100 | #2 | Exceptional 8.7% |
| Thais | 100.0 /100 | #3 | Exceptional 8.7% |
| Immigrants | Taiwan | 100.0 /100 | #4 | Exceptional 8.9% |
| Maltese | 100.0 /100 | #5 | Exceptional 9.1% |
| Assyrians/Chaldeans/Syriacs | 99.9 /100 | #6 | Exceptional 9.1% |
| Immigrants | Ireland | 99.9 /100 | #7 | Exceptional 9.1% |
| Filipinos | 99.9 /100 | #8 | Exceptional 9.2% |
| Immigrants | South Central Asia | 99.9 /100 | #9 | Exceptional 9.3% |
| Bulgarians | 99.9 /100 | #10 | Exceptional 9.3% |
| Bolivians | 99.9 /100 | #11 | Exceptional 9.4% |
| Immigrants | Bolivia | 99.9 /100 | #12 | Exceptional 9.4% |
| Immigrants | Lithuania | 99.9 /100 | #13 | Exceptional 9.4% |
| Immigrants | North Macedonia | 99.8 /100 | #14 | Exceptional 9.4% |
| Bhutanese | 99.8 /100 | #15 | Exceptional 9.5% |
Demographics Similar to Americans by Male Poverty
In terms of male poverty, the demographic groups most similar to Americans are Nonimmigrants (12.1%, a difference of 0.040%), Japanese (12.2%, a difference of 0.35%), Immigrants from Uzbekistan (12.2%, a difference of 0.47%), Immigrants from Cambodia (12.2%, a difference of 0.55%), and Immigrants from Panama (12.1%, a difference of 0.56%).
| Demographics | Rating | Rank | Male Poverty |
| Panamanians | 6.2 /100 | #205 | Tragic 11.9% |
| Immigrants | Eastern Africa | 5.4 /100 | #206 | Tragic 12.0% |
| Malaysians | 5.2 /100 | #207 | Tragic 12.0% |
| Immigrants | Immigrants | 4.5 /100 | #208 | Tragic 12.0% |
| Immigrants | Azores | 4.3 /100 | #209 | Tragic 12.0% |
| Moroccans | 4.2 /100 | #210 | Tragic 12.0% |
| Immigrants | Panama | 4.0 /100 | #211 | Tragic 12.1% |
| Americans | 3.2 /100 | #212 | Tragic 12.1% |
| Immigrants | Nonimmigrants | 3.1 /100 | #213 | Tragic 12.1% |
| Japanese | 2.7 /100 | #214 | Tragic 12.2% |
| Immigrants | Uzbekistan | 2.6 /100 | #215 | Tragic 12.2% |
| Immigrants | Cambodia | 2.5 /100 | #216 | Tragic 12.2% |
| Immigrants | Thailand | 2.5 /100 | #217 | Tragic 12.2% |
| German Russians | 2.5 /100 | #218 | Tragic 12.2% |
| Bermudans | 2.4 /100 | #219 | Tragic 12.2% |