Scotch-Irish vs Ugandan Associate's Degree
COMPARE
Scotch-Irish
Ugandan
Associate's Degree
Associate's Degree Comparison
Scotch-Irish
Ugandans
45.3%
ASSOCIATE'S DEGREE
22.3/ 100
METRIC RATING
197th/ 347
METRIC RANK
48.7%
ASSOCIATE'S DEGREE
93.9/ 100
METRIC RATING
121st/ 347
METRIC RANK
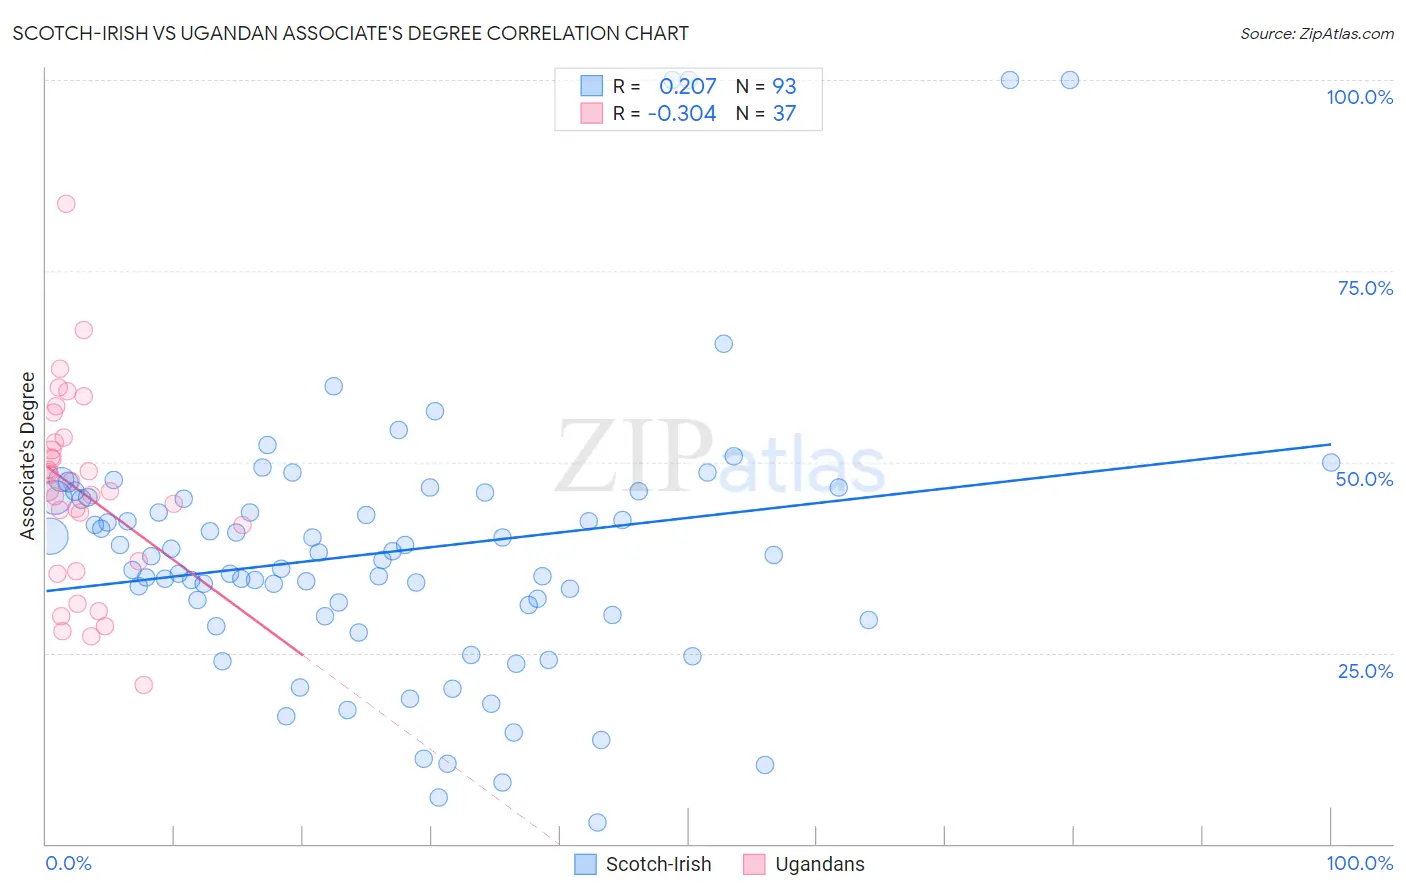
Scotch-Irish vs Ugandan Associate's Degree Correlation Chart
The statistical analysis conducted on geographies consisting of 548,737,246 people shows a weak positive correlation between the proportion of Scotch-Irish and percentage of population with at least associate's degree education in the United States with a correlation coefficient (R) of 0.207 and weighted average of 45.3%. Similarly, the statistical analysis conducted on geographies consisting of 94,018,576 people shows a mild negative correlation between the proportion of Ugandans and percentage of population with at least associate's degree education in the United States with a correlation coefficient (R) of -0.304 and weighted average of 48.7%, a difference of 7.6%.
Associate's Degree Correlation Summary
| Measurement | Scotch-Irish | Ugandan |
| Minimum | 2.9% | 20.8% |
| Maximum | 100.0% | 83.8% |
| Range | 97.1% | 63.0% |
| Mean | 38.2% | 46.2% |
| Median | 37.7% | 46.4% |
| Interquartile 25% (IQ1) | 29.9% | 36.3% |
| Interquartile 75% (IQ3) | 45.3% | 52.8% |
| Interquartile Range (IQR) | 15.5% | 16.5% |
| Standard Deviation (Sample) | 17.9% | 12.7% |
| Standard Deviation (Population) | 17.8% | 12.5% |
Similar Demographics by Associate's Degree
Demographics Similar to Scotch-Irish by Associate's Degree
In terms of associate's degree, the demographic groups most similar to Scotch-Irish are Immigrants from Bangladesh (45.2%, a difference of 0.10%), Immigrants from Senegal (45.2%, a difference of 0.12%), Senegalese (45.2%, a difference of 0.13%), Immigrants from Vietnam (45.2%, a difference of 0.16%), and Spaniard (45.2%, a difference of 0.21%).
| Demographics | Rating | Rank | Associate's Degree |
| Vietnamese | 34.0 /100 | #190 | Fair 45.8% |
| Koreans | 33.8 /100 | #191 | Fair 45.8% |
| Celtics | 33.3 /100 | #192 | Fair 45.8% |
| Immigrants | Cameroon | 31.0 /100 | #193 | Fair 45.7% |
| Immigrants | Peru | 27.6 /100 | #194 | Fair 45.5% |
| Germans | 26.5 /100 | #195 | Fair 45.5% |
| French | 25.6 /100 | #196 | Fair 45.4% |
| Scotch-Irish | 22.3 /100 | #197 | Fair 45.3% |
| Immigrants | Bangladesh | 21.3 /100 | #198 | Fair 45.2% |
| Immigrants | Senegal | 21.2 /100 | #199 | Fair 45.2% |
| Senegalese | 21.1 /100 | #200 | Fair 45.2% |
| Immigrants | Vietnam | 20.8 /100 | #201 | Fair 45.2% |
| Spaniards | 20.4 /100 | #202 | Fair 45.2% |
| Immigrants | South Eastern Asia | 20.2 /100 | #203 | Fair 45.2% |
| Nigerians | 19.1 /100 | #204 | Poor 45.1% |
Demographics Similar to Ugandans by Associate's Degree
In terms of associate's degree, the demographic groups most similar to Ugandans are Italian (48.7%, a difference of 0.0%), Brazilian (48.7%, a difference of 0.070%), Alsatian (48.8%, a difference of 0.23%), Lebanese (48.8%, a difference of 0.25%), and Albanian (48.8%, a difference of 0.26%).
| Demographics | Rating | Rank | Associate's Degree |
| Arabs | 95.3 /100 | #114 | Exceptional 49.0% |
| Luxembourgers | 95.1 /100 | #115 | Exceptional 48.9% |
| British | 95.0 /100 | #116 | Exceptional 48.9% |
| Afghans | 94.8 /100 | #117 | Exceptional 48.9% |
| Albanians | 94.7 /100 | #118 | Exceptional 48.8% |
| Lebanese | 94.6 /100 | #119 | Exceptional 48.8% |
| Alsatians | 94.6 /100 | #120 | Exceptional 48.8% |
| Ugandans | 93.9 /100 | #121 | Exceptional 48.7% |
| Italians | 93.9 /100 | #122 | Exceptional 48.7% |
| Brazilians | 93.7 /100 | #123 | Exceptional 48.7% |
| Serbians | 92.6 /100 | #124 | Exceptional 48.5% |
| Chinese | 92.5 /100 | #125 | Exceptional 48.5% |
| Immigrants | Syria | 92.2 /100 | #126 | Exceptional 48.5% |
| Immigrants | Uganda | 92.1 /100 | #127 | Exceptional 48.5% |
| Immigrants | Eastern Africa | 91.6 /100 | #128 | Exceptional 48.4% |