Scotch-Irish vs Palestinian Child Poverty Under the Age of 16
COMPARE
Scotch-Irish
Palestinian
Child Poverty Under the Age of 16
Child Poverty Under the Age of 16 Comparison
Scotch-Irish
Palestinians
16.3%
CHILD POVERTY UNDER THE AGE OF 16
47.1/ 100
METRIC RATING
175th/ 347
METRIC RANK
15.1%
CHILD POVERTY UNDER THE AGE OF 16
90.9/ 100
METRIC RATING
125th/ 347
METRIC RANK
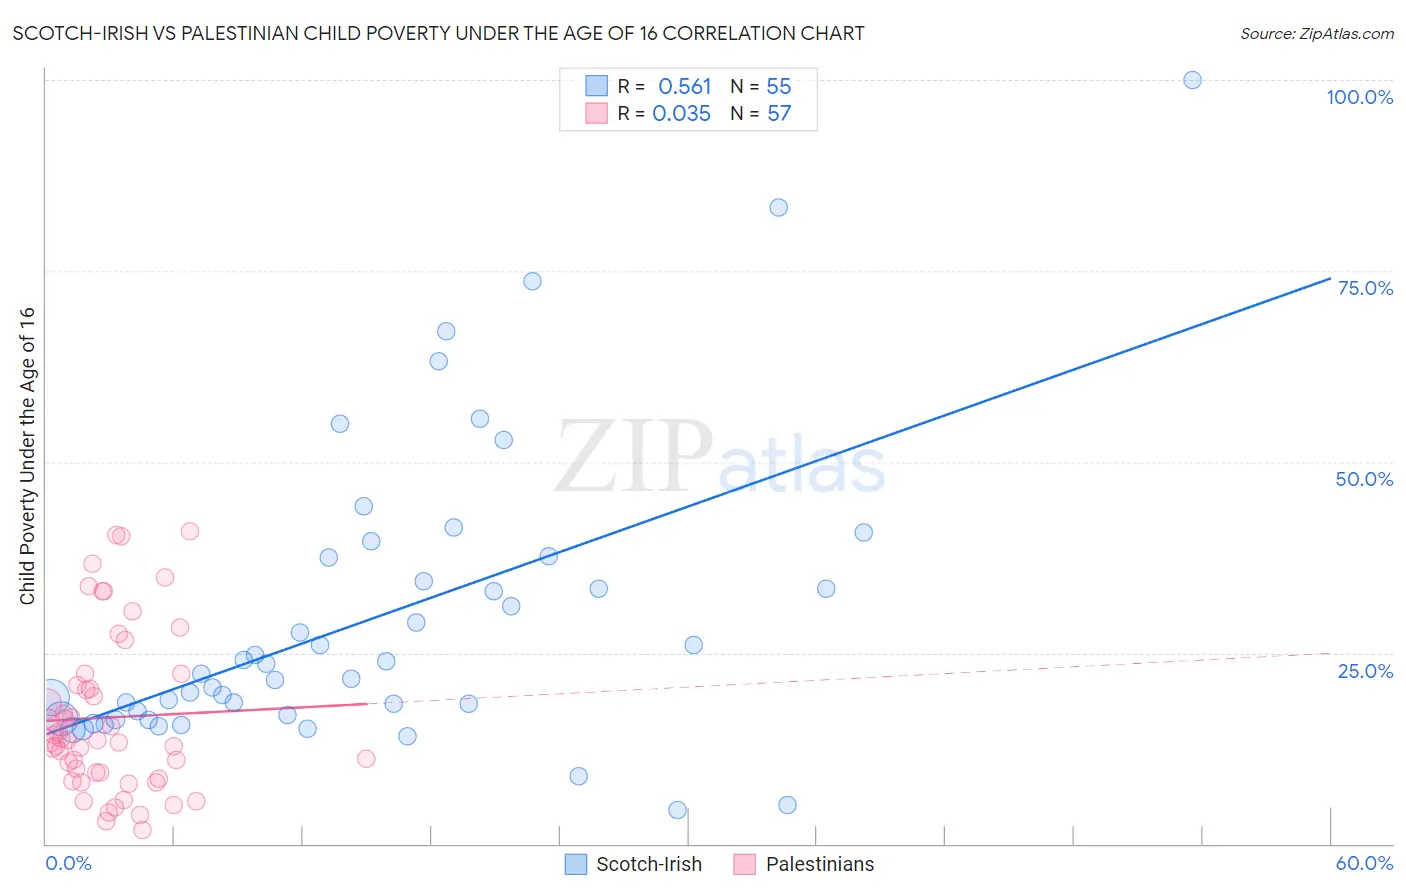
Scotch-Irish vs Palestinian Child Poverty Under the Age of 16 Correlation Chart
The statistical analysis conducted on geographies consisting of 537,994,526 people shows a substantial positive correlation between the proportion of Scotch-Irish and poverty level among children under the age of 16 in the United States with a correlation coefficient (R) of 0.561 and weighted average of 16.3%. Similarly, the statistical analysis conducted on geographies consisting of 215,678,574 people shows no correlation between the proportion of Palestinians and poverty level among children under the age of 16 in the United States with a correlation coefficient (R) of 0.035 and weighted average of 15.1%, a difference of 7.8%.
Child Poverty Under the Age of 16 Correlation Summary
| Measurement | Scotch-Irish | Palestinian |
| Minimum | 4.3% | 1.8% |
| Maximum | 100.0% | 40.9% |
| Range | 95.7% | 39.1% |
| Mean | 29.5% | 16.5% |
| Median | 22.3% | 13.6% |
| Interquartile 25% (IQ1) | 16.3% | 8.9% |
| Interquartile 75% (IQ3) | 37.5% | 21.5% |
| Interquartile Range (IQR) | 21.2% | 12.5% |
| Standard Deviation (Sample) | 19.5% | 10.4% |
| Standard Deviation (Population) | 19.3% | 10.3% |
Similar Demographics by Child Poverty Under the Age of 16
Demographics Similar to Scotch-Irish by Child Poverty Under the Age of 16
In terms of child poverty under the age of 16, the demographic groups most similar to Scotch-Irish are Lebanese (16.3%, a difference of 0.15%), White/Caucasian (16.2%, a difference of 0.34%), Ethiopian (16.3%, a difference of 0.45%), Immigrants from Ethiopia (16.4%, a difference of 0.58%), and Immigrants from Syria (16.4%, a difference of 0.59%).
| Demographics | Rating | Rank | Child Poverty Under the Age of 16 |
| South Americans | 57.9 /100 | #168 | Average 16.0% |
| Uruguayans | 54.7 /100 | #169 | Average 16.1% |
| Immigrants | Colombia | 54.4 /100 | #170 | Average 16.1% |
| Hungarians | 52.5 /100 | #171 | Average 16.2% |
| Afghans | 52.3 /100 | #172 | Average 16.2% |
| Immigrants | Saudi Arabia | 52.1 /100 | #173 | Average 16.2% |
| Whites/Caucasians | 50.0 /100 | #174 | Average 16.2% |
| Scotch-Irish | 47.1 /100 | #175 | Average 16.3% |
| Lebanese | 45.9 /100 | #176 | Average 16.3% |
| Ethiopians | 43.4 /100 | #177 | Average 16.3% |
| Immigrants | Ethiopia | 42.3 /100 | #178 | Average 16.4% |
| Immigrants | Syria | 42.3 /100 | #179 | Average 16.4% |
| South American Indians | 41.8 /100 | #180 | Average 16.4% |
| Immigrants | South America | 40.8 /100 | #181 | Average 16.4% |
| Hawaiians | 38.2 /100 | #182 | Fair 16.4% |
Demographics Similar to Palestinians by Child Poverty Under the Age of 16
In terms of child poverty under the age of 16, the demographic groups most similar to Palestinians are Immigrants from Brazil (15.1%, a difference of 0.040%), Czechoslovakian (15.1%, a difference of 0.040%), Portuguese (15.1%, a difference of 0.14%), Immigrants from Western Europe (15.1%, a difference of 0.23%), and Pakistani (15.0%, a difference of 0.29%).
| Demographics | Rating | Rank | Child Poverty Under the Age of 16 |
| Immigrants | Malaysia | 92.6 /100 | #118 | Exceptional 15.0% |
| Scottish | 92.3 /100 | #119 | Exceptional 15.0% |
| South Africans | 92.1 /100 | #120 | Exceptional 15.0% |
| Immigrants | Zimbabwe | 92.1 /100 | #121 | Exceptional 15.0% |
| Pakistanis | 91.7 /100 | #122 | Exceptional 15.0% |
| Immigrants | Brazil | 91.1 /100 | #123 | Exceptional 15.1% |
| Czechoslovakians | 91.0 /100 | #124 | Exceptional 15.1% |
| Palestinians | 90.9 /100 | #125 | Exceptional 15.1% |
| Portuguese | 90.6 /100 | #126 | Exceptional 15.1% |
| Immigrants | Western Europe | 90.3 /100 | #127 | Exceptional 15.1% |
| Immigrants | Kazakhstan | 90.2 /100 | #128 | Exceptional 15.1% |
| Immigrants | Southern Europe | 89.7 /100 | #129 | Excellent 15.1% |
| Mongolians | 89.5 /100 | #130 | Excellent 15.2% |
| Armenians | 89.4 /100 | #131 | Excellent 15.2% |
| Canadians | 89.1 /100 | #132 | Excellent 15.2% |