Scotch-Irish vs Assyrian/Chaldean/Syriac Child Poverty Under the Age of 16
COMPARE
Scotch-Irish
Assyrian/Chaldean/Syriac
Child Poverty Under the Age of 16
Child Poverty Under the Age of 16 Comparison
Scotch-Irish
Assyrians/Chaldeans/Syriacs
16.3%
CHILD POVERTY UNDER THE AGE OF 16
47.1/ 100
METRIC RATING
175th/ 347
METRIC RANK
13.3%
CHILD POVERTY UNDER THE AGE OF 16
99.7/ 100
METRIC RATING
28th/ 347
METRIC RANK
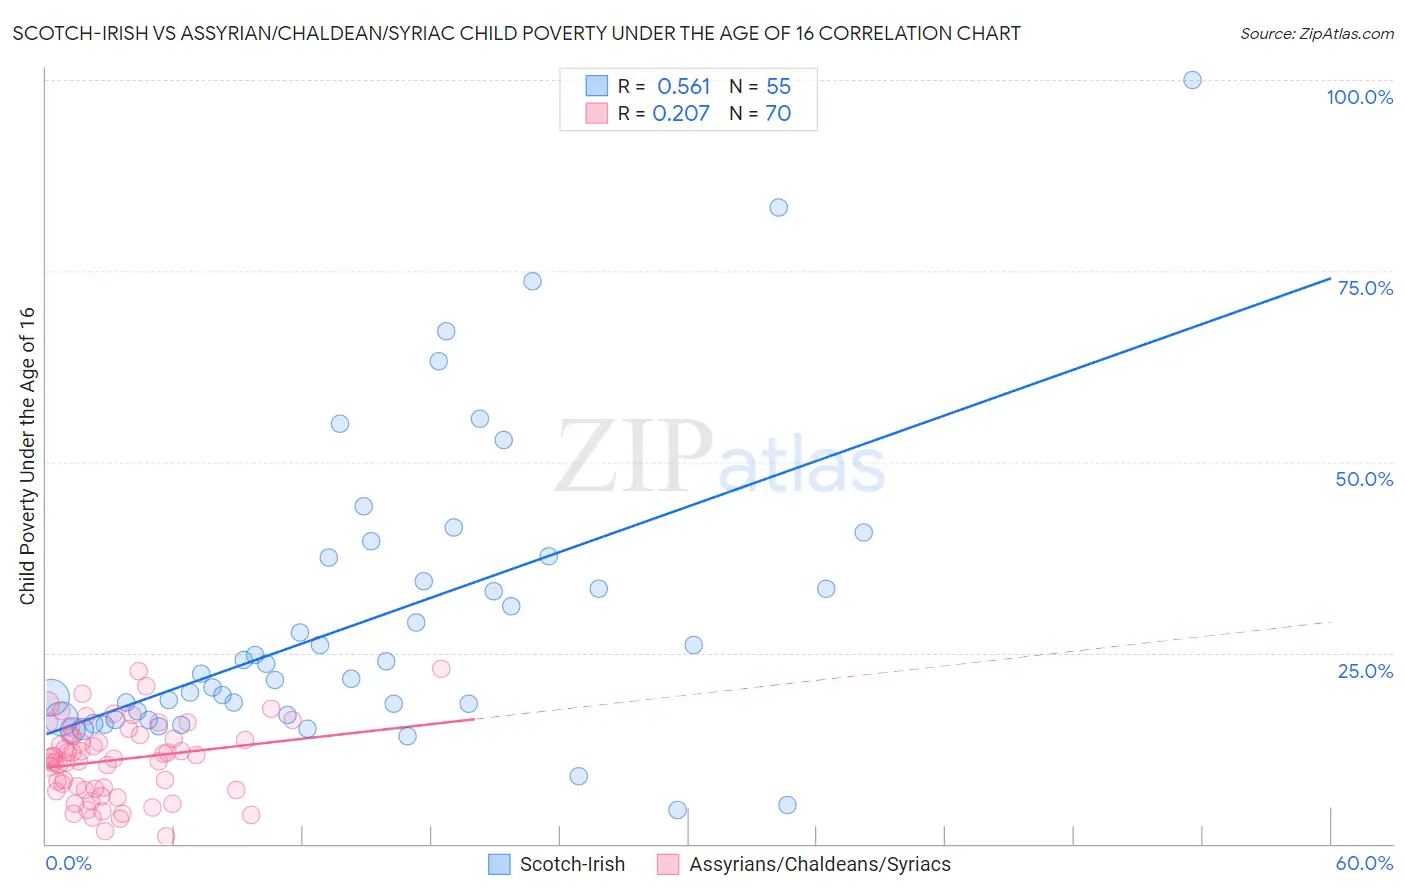
Scotch-Irish vs Assyrian/Chaldean/Syriac Child Poverty Under the Age of 16 Correlation Chart
The statistical analysis conducted on geographies consisting of 537,994,526 people shows a substantial positive correlation between the proportion of Scotch-Irish and poverty level among children under the age of 16 in the United States with a correlation coefficient (R) of 0.561 and weighted average of 16.3%. Similarly, the statistical analysis conducted on geographies consisting of 109,836,821 people shows a weak positive correlation between the proportion of Assyrians/Chaldeans/Syriacs and poverty level among children under the age of 16 in the United States with a correlation coefficient (R) of 0.207 and weighted average of 13.3%, a difference of 22.2%.
Child Poverty Under the Age of 16 Correlation Summary
| Measurement | Scotch-Irish | Assyrian/Chaldean/Syriac |
| Minimum | 4.3% | 0.91% |
| Maximum | 100.0% | 23.0% |
| Range | 95.7% | 22.1% |
| Mean | 29.5% | 11.0% |
| Median | 22.3% | 11.3% |
| Interquartile 25% (IQ1) | 16.3% | 7.0% |
| Interquartile 75% (IQ3) | 37.5% | 14.2% |
| Interquartile Range (IQR) | 21.2% | 7.2% |
| Standard Deviation (Sample) | 19.5% | 5.0% |
| Standard Deviation (Population) | 19.3% | 5.0% |
Similar Demographics by Child Poverty Under the Age of 16
Demographics Similar to Scotch-Irish by Child Poverty Under the Age of 16
In terms of child poverty under the age of 16, the demographic groups most similar to Scotch-Irish are Lebanese (16.3%, a difference of 0.15%), White/Caucasian (16.2%, a difference of 0.34%), Ethiopian (16.3%, a difference of 0.45%), Immigrants from Ethiopia (16.4%, a difference of 0.58%), and Immigrants from Syria (16.4%, a difference of 0.59%).
| Demographics | Rating | Rank | Child Poverty Under the Age of 16 |
| South Americans | 57.9 /100 | #168 | Average 16.0% |
| Uruguayans | 54.7 /100 | #169 | Average 16.1% |
| Immigrants | Colombia | 54.4 /100 | #170 | Average 16.1% |
| Hungarians | 52.5 /100 | #171 | Average 16.2% |
| Afghans | 52.3 /100 | #172 | Average 16.2% |
| Immigrants | Saudi Arabia | 52.1 /100 | #173 | Average 16.2% |
| Whites/Caucasians | 50.0 /100 | #174 | Average 16.2% |
| Scotch-Irish | 47.1 /100 | #175 | Average 16.3% |
| Lebanese | 45.9 /100 | #176 | Average 16.3% |
| Ethiopians | 43.4 /100 | #177 | Average 16.3% |
| Immigrants | Ethiopia | 42.3 /100 | #178 | Average 16.4% |
| Immigrants | Syria | 42.3 /100 | #179 | Average 16.4% |
| South American Indians | 41.8 /100 | #180 | Average 16.4% |
| Immigrants | South America | 40.8 /100 | #181 | Average 16.4% |
| Hawaiians | 38.2 /100 | #182 | Fair 16.4% |
Demographics Similar to Assyrians/Chaldeans/Syriacs by Child Poverty Under the Age of 16
In terms of child poverty under the age of 16, the demographic groups most similar to Assyrians/Chaldeans/Syriacs are Swedish (13.3%, a difference of 0.18%), Immigrants from China (13.3%, a difference of 0.24%), Turkish (13.4%, a difference of 0.48%), Bolivian (13.2%, a difference of 0.53%), and Danish (13.4%, a difference of 0.68%).
| Demographics | Rating | Rank | Child Poverty Under the Age of 16 |
| Immigrants | Eastern Asia | 99.8 /100 | #21 | Exceptional 13.1% |
| Maltese | 99.8 /100 | #22 | Exceptional 13.1% |
| Indians (Asian) | 99.8 /100 | #23 | Exceptional 13.1% |
| Latvians | 99.8 /100 | #24 | Exceptional 13.2% |
| Eastern Europeans | 99.8 /100 | #25 | Exceptional 13.2% |
| Bolivians | 99.8 /100 | #26 | Exceptional 13.2% |
| Immigrants | China | 99.8 /100 | #27 | Exceptional 13.3% |
| Assyrians/Chaldeans/Syriacs | 99.7 /100 | #28 | Exceptional 13.3% |
| Swedes | 99.7 /100 | #29 | Exceptional 13.3% |
| Turks | 99.7 /100 | #30 | Exceptional 13.4% |
| Danes | 99.7 /100 | #31 | Exceptional 13.4% |
| Tongans | 99.7 /100 | #32 | Exceptional 13.4% |
| Asians | 99.6 /100 | #33 | Exceptional 13.5% |
| Russians | 99.6 /100 | #34 | Exceptional 13.5% |
| Lithuanians | 99.6 /100 | #35 | Exceptional 13.5% |