Immigrants from Belize vs Native/Alaskan Seniors Poverty Over the Age of 65
COMPARE
Immigrants from Belize
Native/Alaskan
Seniors Poverty Over the Age of 65
Seniors Poverty Over the Age of 65 Comparison
Immigrants from Belize
Natives/Alaskans
14.0%
SENIORS POVERTY OVER THE AGE OF 65
0.0/ 100
METRIC RATING
298th/ 347
METRIC RANK
14.2%
SENIORS POVERTY OVER THE AGE OF 65
0.0/ 100
METRIC RATING
311th/ 347
METRIC RANK
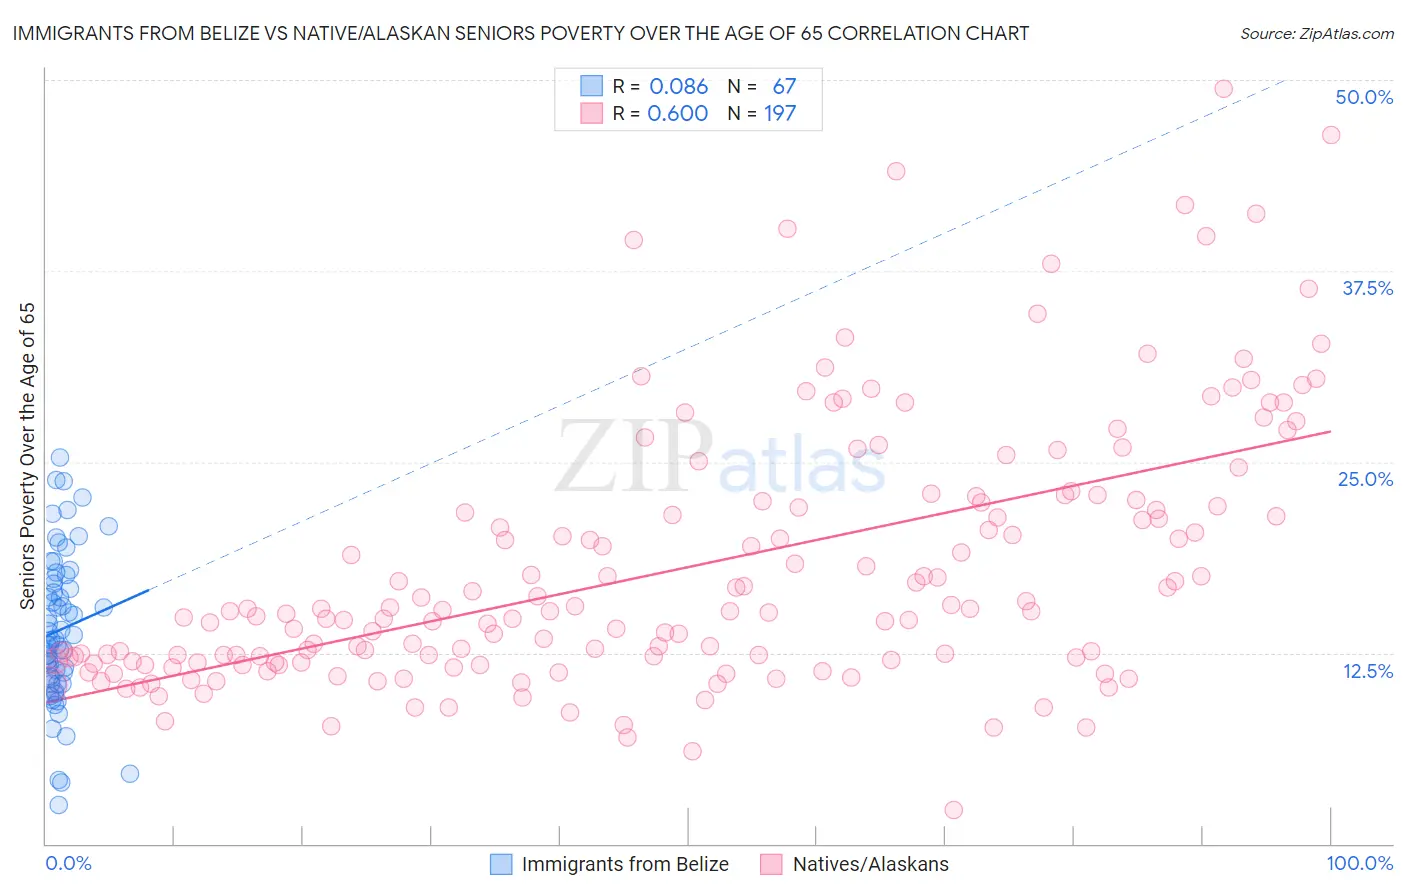
Immigrants from Belize vs Native/Alaskan Seniors Poverty Over the Age of 65 Correlation Chart
The statistical analysis conducted on geographies consisting of 130,248,265 people shows a slight positive correlation between the proportion of Immigrants from Belize and poverty level among seniors over the age of 65 in the United States with a correlation coefficient (R) of 0.086 and weighted average of 14.0%. Similarly, the statistical analysis conducted on geographies consisting of 510,101,075 people shows a substantial positive correlation between the proportion of Natives/Alaskans and poverty level among seniors over the age of 65 in the United States with a correlation coefficient (R) of 0.600 and weighted average of 14.2%, a difference of 1.7%.
Seniors Poverty Over the Age of 65 Correlation Summary
| Measurement | Immigrants from Belize | Native/Alaskan |
| Minimum | 2.5% | 2.2% |
| Maximum | 25.3% | 49.4% |
| Range | 22.8% | 47.2% |
| Mean | 14.0% | 18.1% |
| Median | 13.4% | 15.2% |
| Interquartile 25% (IQ1) | 10.8% | 11.9% |
| Interquartile 75% (IQ3) | 17.3% | 22.3% |
| Interquartile Range (IQR) | 6.6% | 10.4% |
| Standard Deviation (Sample) | 4.9% | 8.6% |
| Standard Deviation (Population) | 4.9% | 8.6% |
Demographics Similar to Immigrants from Belize and Natives/Alaskans by Seniors Poverty Over the Age of 65
In terms of seniors poverty over the age of 65, the demographic groups most similar to Immigrants from Belize are Ecuadorian (14.0%, a difference of 0.070%), Immigrants from Uzbekistan (14.0%, a difference of 0.15%), Vietnamese (14.0%, a difference of 0.28%), Immigrants from Jamaica (13.9%, a difference of 0.36%), and U.S. Virgin Islander (14.0%, a difference of 0.36%). Similarly, the demographic groups most similar to Natives/Alaskans are Bahamian (14.2%, a difference of 0.010%), Honduran (14.2%, a difference of 0.27%), Trinidadian and Tobagonian (14.2%, a difference of 0.36%), Immigrants from West Indies (14.2%, a difference of 0.44%), and Hispanic or Latino (14.3%, a difference of 0.54%).
| Demographics | Rating | Rank | Seniors Poverty Over the Age of 65 |
| Cheyenne | 0.0 /100 | #294 | Tragic 13.9% |
| Apache | 0.0 /100 | #295 | Tragic 13.9% |
| Immigrants | Jamaica | 0.0 /100 | #296 | Tragic 13.9% |
| Vietnamese | 0.0 /100 | #297 | Tragic 14.0% |
| Immigrants | Belize | 0.0 /100 | #298 | Tragic 14.0% |
| Ecuadorians | 0.0 /100 | #299 | Tragic 14.0% |
| Immigrants | Uzbekistan | 0.0 /100 | #300 | Tragic 14.0% |
| U.S. Virgin Islanders | 0.0 /100 | #301 | Tragic 14.0% |
| Yup'ik | 0.0 /100 | #302 | Tragic 14.1% |
| Immigrants | Bangladesh | 0.0 /100 | #303 | Tragic 14.1% |
| West Indians | 0.0 /100 | #304 | Tragic 14.1% |
| Immigrants | Trinidad and Tobago | 0.0 /100 | #305 | Tragic 14.1% |
| Immigrants | Latin America | 0.0 /100 | #306 | Tragic 14.2% |
| Immigrants | West Indies | 0.0 /100 | #307 | Tragic 14.2% |
| Trinidadians and Tobagonians | 0.0 /100 | #308 | Tragic 14.2% |
| Hondurans | 0.0 /100 | #309 | Tragic 14.2% |
| Bahamians | 0.0 /100 | #310 | Tragic 14.2% |
| Natives/Alaskans | 0.0 /100 | #311 | Tragic 14.2% |
| Hispanics or Latinos | 0.0 /100 | #312 | Tragic 14.3% |
| Barbadians | 0.0 /100 | #313 | Tragic 14.4% |
| Guyanese | 0.0 /100 | #314 | Tragic 14.4% |