Scandinavian vs Ottawa Poverty
COMPARE
Scandinavian
Ottawa
Poverty
Poverty Comparison
Scandinavians
Ottawa
11.1%
POVERTY
98.2/ 100
METRIC RATING
57th/ 347
METRIC RANK
14.3%
POVERTY
0.1/ 100
METRIC RATING
258th/ 347
METRIC RANK
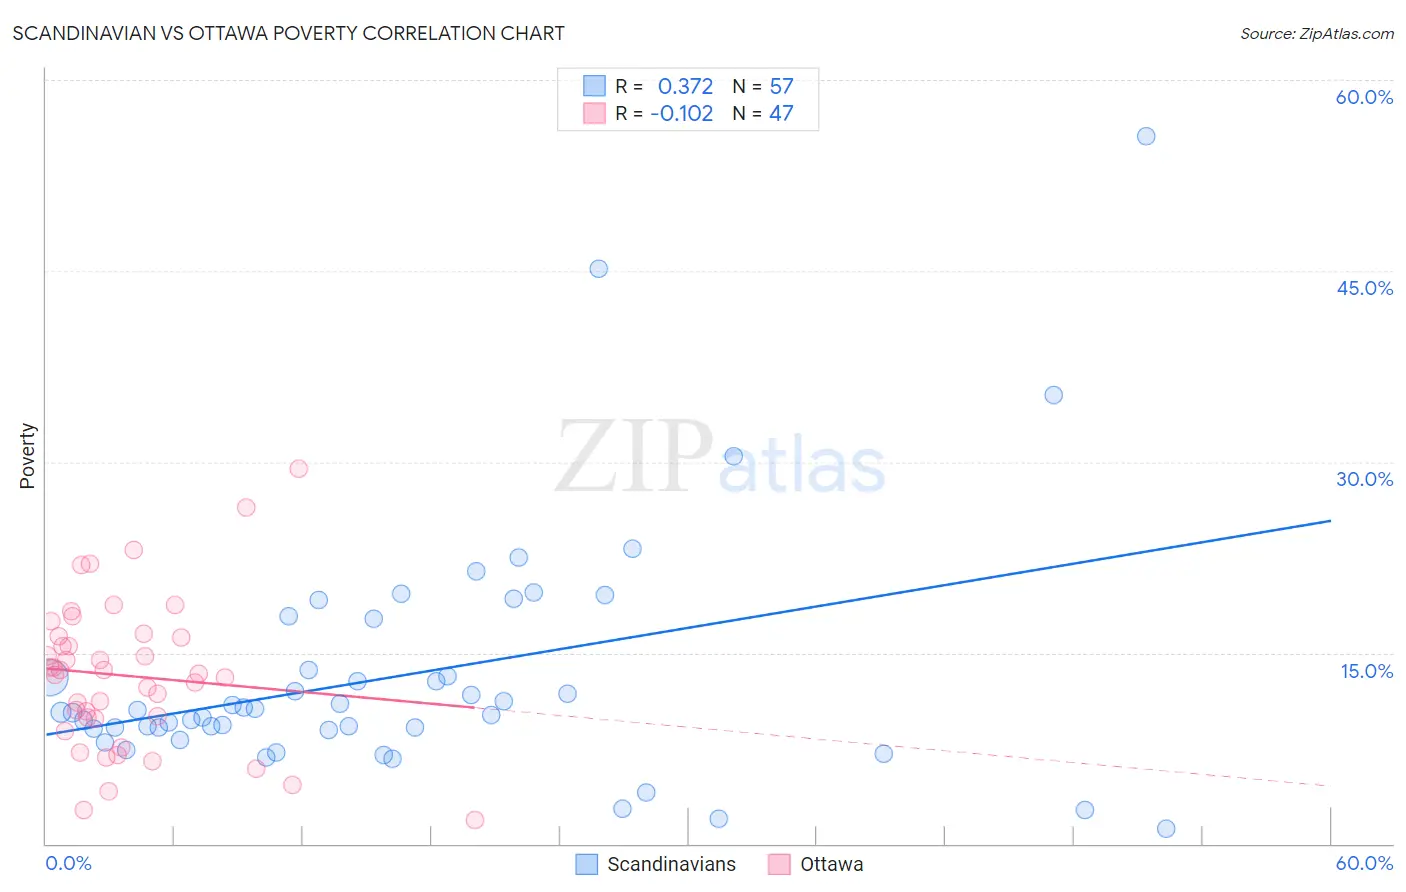
Scandinavian vs Ottawa Poverty Correlation Chart
The statistical analysis conducted on geographies consisting of 472,236,083 people shows a mild positive correlation between the proportion of Scandinavians and poverty level in the United States with a correlation coefficient (R) of 0.372 and weighted average of 11.1%. Similarly, the statistical analysis conducted on geographies consisting of 49,944,420 people shows a poor negative correlation between the proportion of Ottawa and poverty level in the United States with a correlation coefficient (R) of -0.102 and weighted average of 14.3%, a difference of 28.5%.
Poverty Correlation Summary
| Measurement | Scandinavian | Ottawa |
| Minimum | 1.1% | 1.8% |
| Maximum | 55.6% | 29.4% |
| Range | 54.4% | 27.6% |
| Mean | 13.2% | 13.2% |
| Median | 10.3% | 13.4% |
| Interquartile 25% (IQ1) | 9.0% | 9.8% |
| Interquartile 75% (IQ3) | 15.7% | 16.3% |
| Interquartile Range (IQR) | 6.7% | 6.5% |
| Standard Deviation (Sample) | 9.6% | 5.9% |
| Standard Deviation (Population) | 9.6% | 5.8% |
Similar Demographics by Poverty
Demographics Similar to Scandinavians by Poverty
In terms of poverty, the demographic groups most similar to Scandinavians are Estonian (11.1%, a difference of 0.040%), German (11.1%, a difference of 0.060%), Immigrants from Europe (11.2%, a difference of 0.21%), Immigrants from Sri Lanka (11.2%, a difference of 0.37%), and Immigrants from Italy (11.2%, a difference of 0.44%).
| Demographics | Rating | Rank | Poverty |
| Asians | 98.9 /100 | #50 | Exceptional 11.0% |
| Immigrants | Croatia | 98.7 /100 | #51 | Exceptional 11.0% |
| Immigrants | Philippines | 98.7 /100 | #52 | Exceptional 11.0% |
| Immigrants | Austria | 98.6 /100 | #53 | Exceptional 11.1% |
| Immigrants | Bulgaria | 98.5 /100 | #54 | Exceptional 11.1% |
| Immigrants | Serbia | 98.5 /100 | #55 | Exceptional 11.1% |
| Estonians | 98.2 /100 | #56 | Exceptional 11.1% |
| Scandinavians | 98.2 /100 | #57 | Exceptional 11.1% |
| Germans | 98.1 /100 | #58 | Exceptional 11.1% |
| Immigrants | Europe | 98.0 /100 | #59 | Exceptional 11.2% |
| Immigrants | Sri Lanka | 97.9 /100 | #60 | Exceptional 11.2% |
| Immigrants | Italy | 97.9 /100 | #61 | Exceptional 11.2% |
| Austrians | 97.8 /100 | #62 | Exceptional 11.2% |
| Ukrainians | 97.8 /100 | #63 | Exceptional 11.2% |
| Swiss | 97.7 /100 | #64 | Exceptional 11.2% |
Demographics Similar to Ottawa by Poverty
In terms of poverty, the demographic groups most similar to Ottawa are Trinidadian and Tobagonian (14.3%, a difference of 0.010%), Mexican American Indian (14.3%, a difference of 0.050%), Immigrants from Ecuador (14.3%, a difference of 0.070%), Immigrants from El Salvador (14.3%, a difference of 0.17%), and Immigrants from Nicaragua (14.3%, a difference of 0.27%).
| Demographics | Rating | Rank | Poverty |
| Immigrants | Burma/Myanmar | 0.2 /100 | #251 | Tragic 14.2% |
| Spanish American Indians | 0.2 /100 | #252 | Tragic 14.2% |
| Immigrants | Trinidad and Tobago | 0.2 /100 | #253 | Tragic 14.2% |
| Immigrants | El Salvador | 0.1 /100 | #254 | Tragic 14.3% |
| Immigrants | Ecuador | 0.1 /100 | #255 | Tragic 14.3% |
| Mexican American Indians | 0.1 /100 | #256 | Tragic 14.3% |
| Trinidadians and Tobagonians | 0.1 /100 | #257 | Tragic 14.3% |
| Ottawa | 0.1 /100 | #258 | Tragic 14.3% |
| Immigrants | Nicaragua | 0.1 /100 | #259 | Tragic 14.3% |
| Cape Verdeans | 0.1 /100 | #260 | Tragic 14.4% |
| Cherokee | 0.1 /100 | #261 | Tragic 14.4% |
| Immigrants | Liberia | 0.1 /100 | #262 | Tragic 14.4% |
| Jamaicans | 0.1 /100 | #263 | Tragic 14.4% |
| Immigrants | Jamaica | 0.1 /100 | #264 | Tragic 14.4% |
| Immigrants | Guyana | 0.1 /100 | #265 | Tragic 14.5% |