Samoan vs Immigrants from Croatia Child Poverty Among Boys Under 16
COMPARE
Samoan
Immigrants from Croatia
Child Poverty Among Boys Under 16
Child Poverty Among Boys Under 16 Comparison
Samoans
Immigrants from Croatia
15.7%
CHILD POVERTY AMONG BOYS UNDER 16
83.2/ 100
METRIC RATING
145th/ 347
METRIC RANK
14.7%
CHILD POVERTY AMONG BOYS UNDER 16
97.9/ 100
METRIC RATING
76th/ 347
METRIC RANK
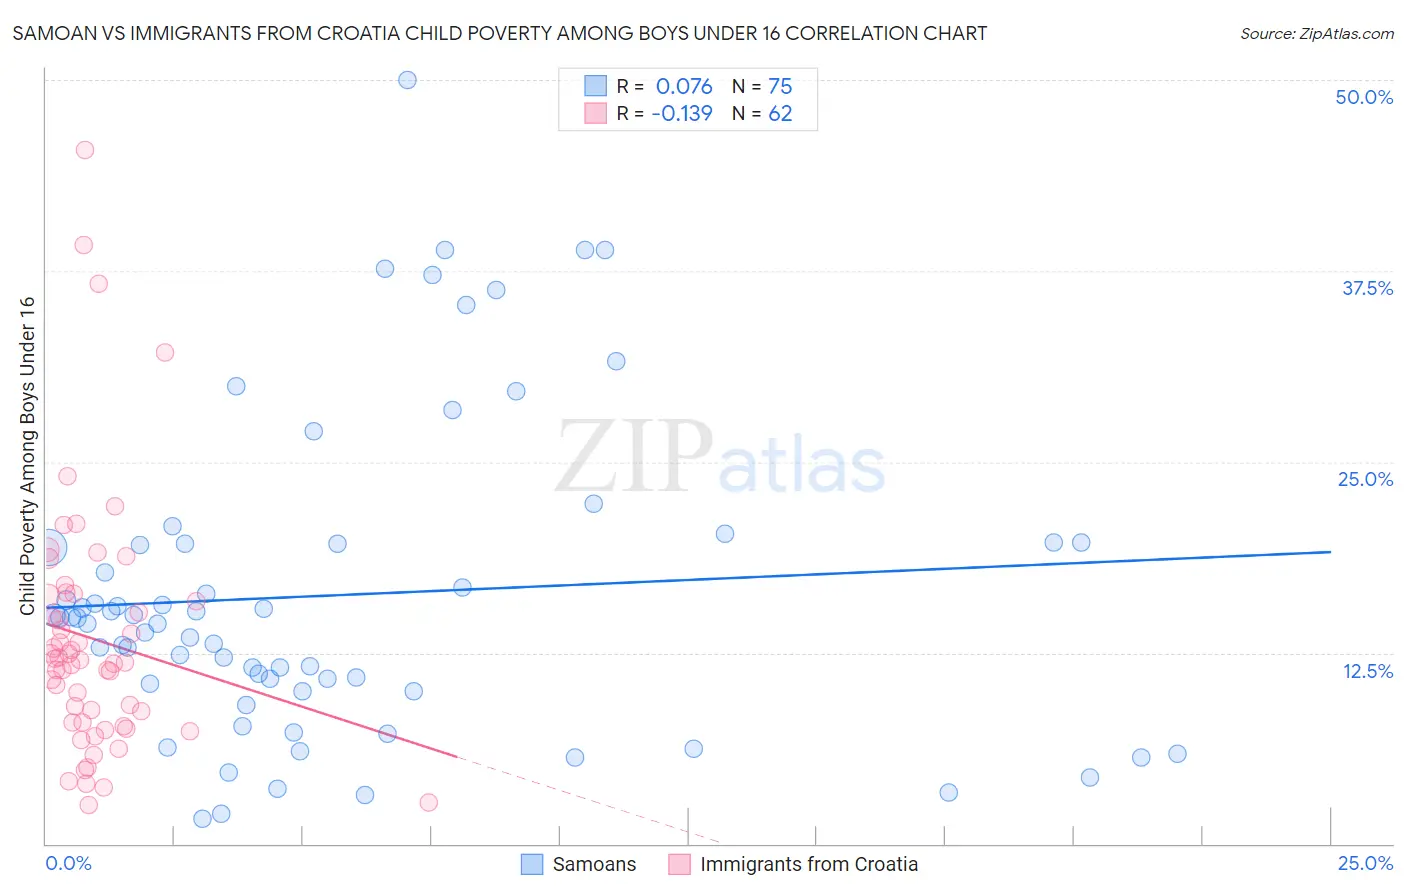
Samoan vs Immigrants from Croatia Child Poverty Among Boys Under 16 Correlation Chart
The statistical analysis conducted on geographies consisting of 223,909,678 people shows a slight positive correlation between the proportion of Samoans and poverty level among boys under the age of 16 in the United States with a correlation coefficient (R) of 0.076 and weighted average of 15.7%. Similarly, the statistical analysis conducted on geographies consisting of 131,435,038 people shows a poor negative correlation between the proportion of Immigrants from Croatia and poverty level among boys under the age of 16 in the United States with a correlation coefficient (R) of -0.139 and weighted average of 14.7%, a difference of 7.0%.
Child Poverty Among Boys Under 16 Correlation Summary
| Measurement | Samoan | Immigrants from Croatia |
| Minimum | 1.7% | 2.5% |
| Maximum | 50.0% | 45.5% |
| Range | 48.3% | 42.9% |
| Mean | 16.3% | 13.4% |
| Median | 14.8% | 11.9% |
| Interquartile 25% (IQ1) | 10.0% | 7.9% |
| Interquartile 75% (IQ3) | 19.7% | 16.3% |
| Interquartile Range (IQR) | 9.7% | 8.3% |
| Standard Deviation (Sample) | 10.3% | 8.3% |
| Standard Deviation (Population) | 10.2% | 8.3% |
Similar Demographics by Child Poverty Among Boys Under 16
Demographics Similar to Samoans by Child Poverty Among Boys Under 16
In terms of child poverty among boys under 16, the demographic groups most similar to Samoans are Immigrants from Peru (15.7%, a difference of 0.060%), Immigrants from Fiji (15.7%, a difference of 0.080%), New Zealander (15.7%, a difference of 0.16%), Immigrants from Hungary (15.7%, a difference of 0.18%), and Venezuelan (15.7%, a difference of 0.22%).
| Demographics | Rating | Rank | Child Poverty Among Boys Under 16 |
| Immigrants | Southern Europe | 86.5 /100 | #138 | Excellent 15.6% |
| Albanians | 86.5 /100 | #139 | Excellent 15.6% |
| Immigrants | Kuwait | 85.6 /100 | #140 | Excellent 15.6% |
| Slavs | 84.5 /100 | #141 | Excellent 15.7% |
| Immigrants | Hungary | 84.1 /100 | #142 | Excellent 15.7% |
| Immigrants | Fiji | 83.6 /100 | #143 | Excellent 15.7% |
| Immigrants | Peru | 83.5 /100 | #144 | Excellent 15.7% |
| Samoans | 83.2 /100 | #145 | Excellent 15.7% |
| New Zealanders | 82.4 /100 | #146 | Excellent 15.7% |
| Venezuelans | 82.1 /100 | #147 | Excellent 15.7% |
| Brazilians | 81.0 /100 | #148 | Excellent 15.8% |
| Slovaks | 80.3 /100 | #149 | Excellent 15.8% |
| Immigrants | Jordan | 80.2 /100 | #150 | Excellent 15.8% |
| Puget Sound Salish | 79.8 /100 | #151 | Good 15.8% |
| Immigrants | Venezuela | 79.5 /100 | #152 | Good 15.8% |
Demographics Similar to Immigrants from Croatia by Child Poverty Among Boys Under 16
In terms of child poverty among boys under 16, the demographic groups most similar to Immigrants from Croatia are Immigrants from Poland (14.7%, a difference of 0.050%), Macedonian (14.7%, a difference of 0.060%), Egyptian (14.7%, a difference of 0.11%), Australian (14.7%, a difference of 0.13%), and Immigrants from Turkey (14.6%, a difference of 0.17%).
| Demographics | Rating | Rank | Child Poverty Among Boys Under 16 |
| Immigrants | Austria | 98.4 /100 | #69 | Exceptional 14.5% |
| Europeans | 98.4 /100 | #70 | Exceptional 14.5% |
| Immigrants | Netherlands | 98.1 /100 | #71 | Exceptional 14.6% |
| Immigrants | Latvia | 98.1 /100 | #72 | Exceptional 14.6% |
| Immigrants | Turkey | 98.0 /100 | #73 | Exceptional 14.6% |
| Australians | 98.0 /100 | #74 | Exceptional 14.7% |
| Immigrants | Poland | 97.9 /100 | #75 | Exceptional 14.7% |
| Immigrants | Croatia | 97.9 /100 | #76 | Exceptional 14.7% |
| Macedonians | 97.9 /100 | #77 | Exceptional 14.7% |
| Egyptians | 97.8 /100 | #78 | Exceptional 14.7% |
| Immigrants | Eastern Europe | 97.8 /100 | #79 | Exceptional 14.7% |
| Immigrants | Russia | 97.7 /100 | #80 | Exceptional 14.7% |
| Immigrants | Canada | 97.6 /100 | #81 | Exceptional 14.7% |
| Ukrainians | 97.6 /100 | #82 | Exceptional 14.7% |
| Immigrants | South Africa | 97.4 /100 | #83 | Exceptional 14.8% |