Mongolian vs Colombian Seniors Poverty Over the Age of 65
COMPARE
Mongolian
Colombian
Seniors Poverty Over the Age of 65
Seniors Poverty Over the Age of 65 Comparison
Mongolians
Colombians
10.9%
SENIORS POVERTY OVER THE AGE OF 65
58.0/ 100
METRIC RATING
168th/ 347
METRIC RANK
12.5%
SENIORS POVERTY OVER THE AGE OF 65
0.2/ 100
METRIC RATING
261st/ 347
METRIC RANK
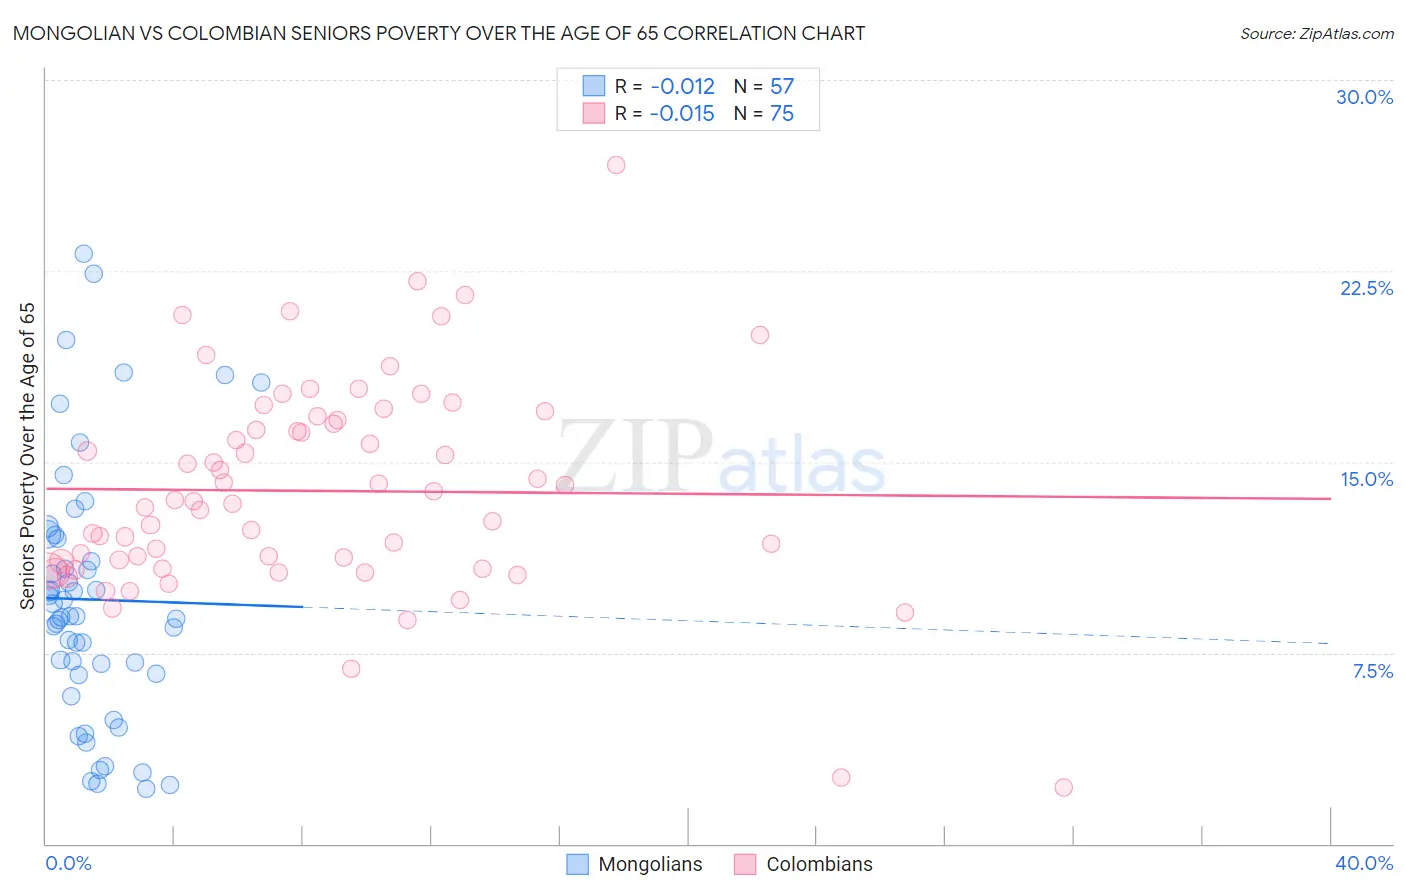
Mongolian vs Colombian Seniors Poverty Over the Age of 65 Correlation Chart
The statistical analysis conducted on geographies consisting of 140,162,165 people shows no correlation between the proportion of Mongolians and poverty level among seniors over the age of 65 in the United States with a correlation coefficient (R) of -0.012 and weighted average of 10.9%. Similarly, the statistical analysis conducted on geographies consisting of 417,709,966 people shows no correlation between the proportion of Colombians and poverty level among seniors over the age of 65 in the United States with a correlation coefficient (R) of -0.015 and weighted average of 12.5%, a difference of 15.2%.
Seniors Poverty Over the Age of 65 Correlation Summary
| Measurement | Mongolian | Colombian |
| Minimum | 2.2% | 2.2% |
| Maximum | 23.2% | 26.7% |
| Range | 21.0% | 24.4% |
| Mean | 9.6% | 13.9% |
| Median | 8.9% | 13.5% |
| Interquartile 25% (IQ1) | 6.7% | 10.8% |
| Interquartile 75% (IQ3) | 12.1% | 16.6% |
| Interquartile Range (IQR) | 5.4% | 5.8% |
| Standard Deviation (Sample) | 5.0% | 4.2% |
| Standard Deviation (Population) | 5.0% | 4.2% |
Similar Demographics by Seniors Poverty Over the Age of 65
Demographics Similar to Mongolians by Seniors Poverty Over the Age of 65
In terms of seniors poverty over the age of 65, the demographic groups most similar to Mongolians are Sri Lankan (10.9%, a difference of 0.10%), Immigrants from Eastern Europe (10.9%, a difference of 0.20%), Alaska Native (10.8%, a difference of 0.22%), Nonimmigrants (10.9%, a difference of 0.26%), and Immigrants from Syria (10.9%, a difference of 0.30%).
| Demographics | Rating | Rank | Seniors Poverty Over the Age of 65 |
| Arabs | 65.2 /100 | #161 | Good 10.8% |
| Immigrants | Indonesia | 64.8 /100 | #162 | Good 10.8% |
| Tsimshian | 64.5 /100 | #163 | Good 10.8% |
| Potawatomi | 62.6 /100 | #164 | Good 10.8% |
| Immigrants | South Eastern Asia | 62.1 /100 | #165 | Good 10.8% |
| Malaysians | 62.0 /100 | #166 | Good 10.8% |
| Alaska Natives | 60.3 /100 | #167 | Good 10.8% |
| Mongolians | 58.0 /100 | #168 | Average 10.9% |
| Sri Lankans | 56.8 /100 | #169 | Average 10.9% |
| Immigrants | Eastern Europe | 55.8 /100 | #170 | Average 10.9% |
| Immigrants | Nonimmigrants | 55.1 /100 | #171 | Average 10.9% |
| Immigrants | Syria | 54.7 /100 | #172 | Average 10.9% |
| Spaniards | 50.7 /100 | #173 | Average 10.9% |
| Immigrants | Sudan | 50.0 /100 | #174 | Average 10.9% |
| Creek | 49.6 /100 | #175 | Average 10.9% |
Demographics Similar to Colombians by Seniors Poverty Over the Age of 65
In terms of seniors poverty over the age of 65, the demographic groups most similar to Colombians are Venezuelan (12.5%, a difference of 0.20%), South American (12.5%, a difference of 0.24%), Soviet Union (12.6%, a difference of 0.37%), Inupiat (12.6%, a difference of 0.43%), and Ghanaian (12.4%, a difference of 0.48%).
| Demographics | Rating | Rank | Seniors Poverty Over the Age of 65 |
| Immigrants | Cambodia | 0.3 /100 | #254 | Tragic 12.4% |
| Mexican American Indians | 0.3 /100 | #255 | Tragic 12.4% |
| Immigrants | Panama | 0.2 /100 | #256 | Tragic 12.4% |
| Immigrants | Immigrants | 0.2 /100 | #257 | Tragic 12.4% |
| Dutch West Indians | 0.2 /100 | #258 | Tragic 12.4% |
| Ghanaians | 0.2 /100 | #259 | Tragic 12.4% |
| South Americans | 0.2 /100 | #260 | Tragic 12.5% |
| Colombians | 0.2 /100 | #261 | Tragic 12.5% |
| Venezuelans | 0.1 /100 | #262 | Tragic 12.5% |
| Soviet Union | 0.1 /100 | #263 | Tragic 12.6% |
| Inupiat | 0.1 /100 | #264 | Tragic 12.6% |
| Immigrants | Western Africa | 0.1 /100 | #265 | Tragic 12.6% |
| Africans | 0.1 /100 | #266 | Tragic 12.6% |
| Blackfeet | 0.1 /100 | #267 | Tragic 12.6% |
| Immigrants | Somalia | 0.1 /100 | #268 | Tragic 12.6% |