Immigrants from Bosnia and Herzegovina vs Immigrants from Laos Receiving Food Stamps
COMPARE
Immigrants from Bosnia and Herzegovina
Immigrants from Laos
Receiving Food Stamps
Receiving Food Stamps Comparison
Immigrants from Bosnia and Herzegovina
Immigrants from Laos
11.3%
RECEIVING FOOD STAMPS
72.6/ 100
METRIC RATING
158th/ 347
METRIC RANK
13.8%
RECEIVING FOOD STAMPS
0.7/ 100
METRIC RATING
248th/ 347
METRIC RANK
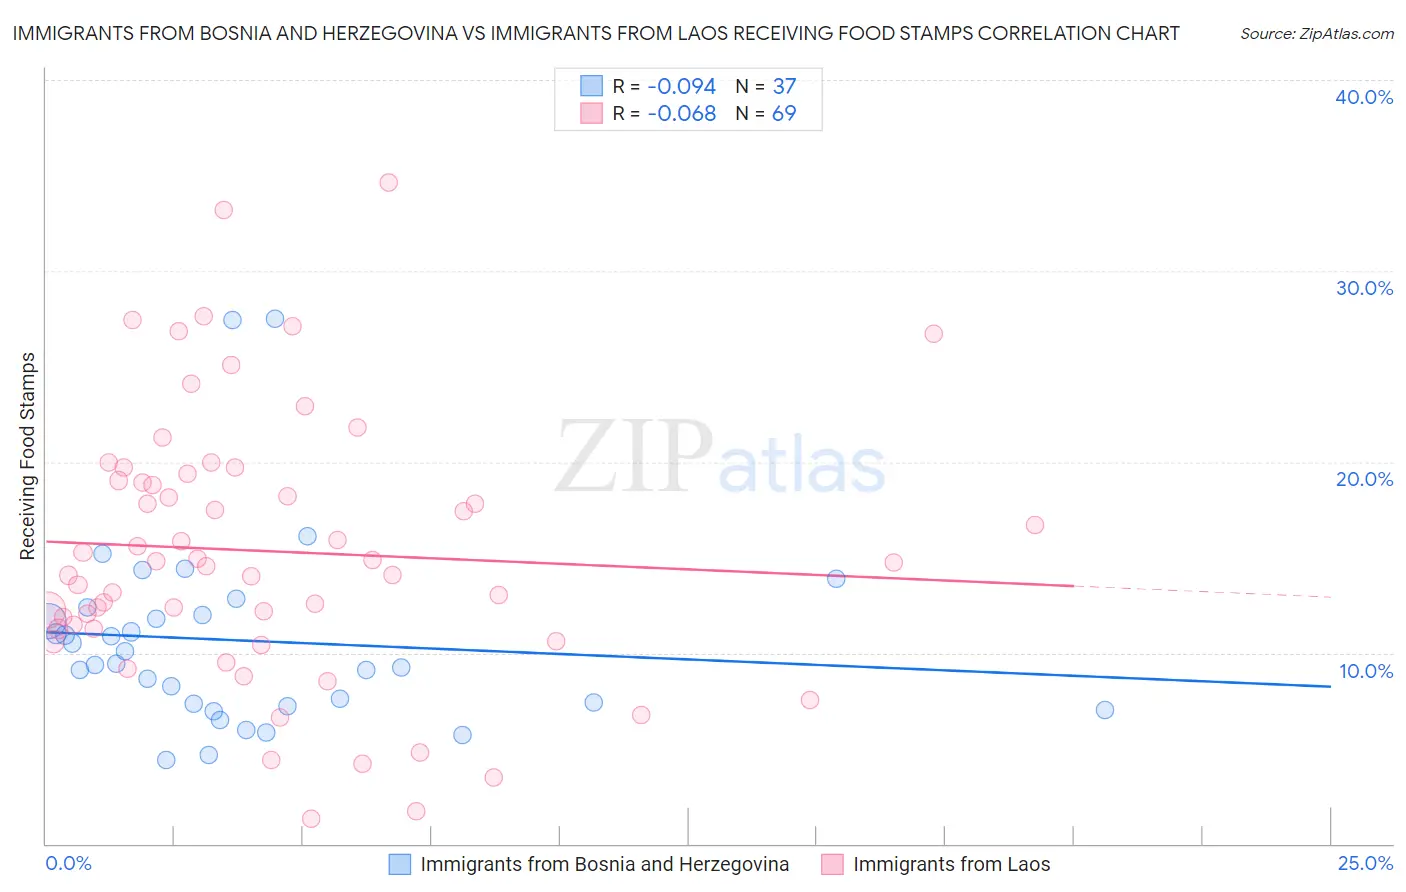
Immigrants from Bosnia and Herzegovina vs Immigrants from Laos Receiving Food Stamps Correlation Chart
The statistical analysis conducted on geographies consisting of 156,646,102 people shows a slight negative correlation between the proportion of Immigrants from Bosnia and Herzegovina and percentage of population receiving government assistance and/or food stamps in the United States with a correlation coefficient (R) of -0.094 and weighted average of 11.3%. Similarly, the statistical analysis conducted on geographies consisting of 201,380,139 people shows a slight negative correlation between the proportion of Immigrants from Laos and percentage of population receiving government assistance and/or food stamps in the United States with a correlation coefficient (R) of -0.068 and weighted average of 13.8%, a difference of 21.4%.
Receiving Food Stamps Correlation Summary
| Measurement | Immigrants from Bosnia and Herzegovina | Immigrants from Laos |
| Minimum | 4.4% | 1.3% |
| Maximum | 27.5% | 34.6% |
| Range | 23.1% | 33.3% |
| Mean | 10.6% | 15.3% |
| Median | 9.4% | 14.7% |
| Interquartile 25% (IQ1) | 7.3% | 11.3% |
| Interquartile 75% (IQ3) | 12.2% | 19.2% |
| Interquartile Range (IQR) | 4.9% | 8.0% |
| Standard Deviation (Sample) | 5.1% | 7.0% |
| Standard Deviation (Population) | 5.0% | 6.9% |
Similar Demographics by Receiving Food Stamps
Demographics Similar to Immigrants from Bosnia and Herzegovina by Receiving Food Stamps
In terms of receiving food stamps, the demographic groups most similar to Immigrants from Bosnia and Herzegovina are Immigrants from Oceania (11.4%, a difference of 0.39%), Immigrants from Lebanon (11.3%, a difference of 0.49%), French Canadian (11.4%, a difference of 0.55%), Immigrants from Afghanistan (11.3%, a difference of 0.56%), and Pennsylvania German (11.4%, a difference of 0.73%).
| Demographics | Rating | Rank | Receiving Food Stamps |
| Immigrants | Spain | 81.7 /100 | #151 | Excellent 11.1% |
| Immigrants | Kazakhstan | 81.7 /100 | #152 | Excellent 11.1% |
| Lebanese | 81.6 /100 | #153 | Excellent 11.1% |
| Armenians | 81.4 /100 | #154 | Excellent 11.1% |
| Immigrants | Argentina | 80.4 /100 | #155 | Excellent 11.2% |
| Immigrants | Afghanistan | 75.6 /100 | #156 | Good 11.3% |
| Immigrants | Lebanon | 75.2 /100 | #157 | Good 11.3% |
| Immigrants | Bosnia and Herzegovina | 72.6 /100 | #158 | Good 11.3% |
| Immigrants | Oceania | 70.4 /100 | #159 | Good 11.4% |
| French Canadians | 69.5 /100 | #160 | Good 11.4% |
| Pennsylvania Germans | 68.4 /100 | #161 | Good 11.4% |
| Alsatians | 68.0 /100 | #162 | Good 11.4% |
| Immigrants | Southern Europe | 65.8 /100 | #163 | Good 11.5% |
| Immigrants | Chile | 65.0 /100 | #164 | Good 11.5% |
| Arabs | 64.7 /100 | #165 | Good 11.5% |
Demographics Similar to Immigrants from Laos by Receiving Food Stamps
In terms of receiving food stamps, the demographic groups most similar to Immigrants from Laos are Mexican American Indian (13.8%, a difference of 0.10%), Cree (13.7%, a difference of 0.36%), Immigrants from Somalia (13.7%, a difference of 0.60%), Indonesian (13.9%, a difference of 0.63%), and Cajun (13.7%, a difference of 0.65%).
| Demographics | Rating | Rank | Receiving Food Stamps |
| Choctaw | 1.0 /100 | #241 | Tragic 13.6% |
| Immigrants | Panama | 1.0 /100 | #242 | Tragic 13.6% |
| Somalis | 0.9 /100 | #243 | Tragic 13.7% |
| Cajuns | 0.9 /100 | #244 | Tragic 13.7% |
| Immigrants | Somalia | 0.9 /100 | #245 | Tragic 13.7% |
| Cree | 0.8 /100 | #246 | Tragic 13.7% |
| Mexican American Indians | 0.7 /100 | #247 | Tragic 13.8% |
| Immigrants | Laos | 0.7 /100 | #248 | Tragic 13.8% |
| Indonesians | 0.6 /100 | #249 | Tragic 13.9% |
| Immigrants | Cambodia | 0.5 /100 | #250 | Tragic 13.9% |
| Yaqui | 0.5 /100 | #251 | Tragic 13.9% |
| Ghanaians | 0.5 /100 | #252 | Tragic 14.0% |
| Spanish Americans | 0.4 /100 | #253 | Tragic 14.0% |
| Marshallese | 0.3 /100 | #254 | Tragic 14.1% |
| Sub-Saharan Africans | 0.3 /100 | #255 | Tragic 14.1% |