Moroccan vs Immigrants from Kazakhstan Female Poverty Among 25-34 Year Olds
COMPARE
Moroccan
Immigrants from Kazakhstan
Female Poverty Among 25-34 Year Olds
Female Poverty Among 25-34 Year Olds Comparison
Moroccans
Immigrants from Kazakhstan
13.8%
FEMALE POVERTY AMONG 25-34 YEAR OLDS
25.1/ 100
METRIC RATING
194th/ 347
METRIC RANK
12.4%
FEMALE POVERTY AMONG 25-34 YEAR OLDS
98.1/ 100
METRIC RATING
81st/ 347
METRIC RANK
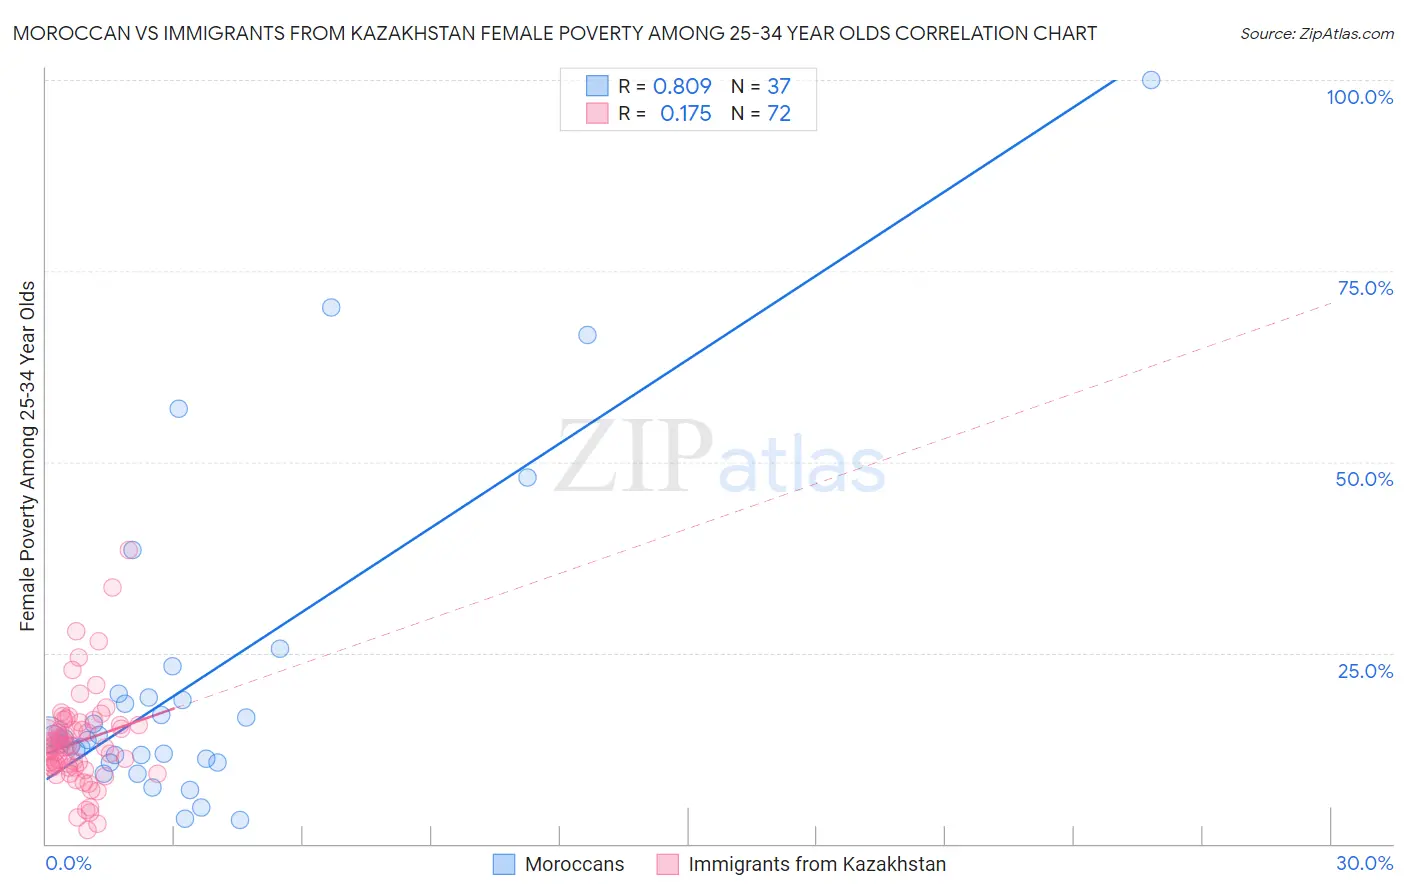
Moroccan vs Immigrants from Kazakhstan Female Poverty Among 25-34 Year Olds Correlation Chart
The statistical analysis conducted on geographies consisting of 200,251,760 people shows a very strong positive correlation between the proportion of Moroccans and poverty level among females between the ages 25 and 34 in the United States with a correlation coefficient (R) of 0.809 and weighted average of 13.8%. Similarly, the statistical analysis conducted on geographies consisting of 123,655,702 people shows a poor positive correlation between the proportion of Immigrants from Kazakhstan and poverty level among females between the ages 25 and 34 in the United States with a correlation coefficient (R) of 0.175 and weighted average of 12.4%, a difference of 11.4%.
Female Poverty Among 25-34 Year Olds Correlation Summary
| Measurement | Moroccan | Immigrants from Kazakhstan |
| Minimum | 3.1% | 1.8% |
| Maximum | 100.0% | 38.5% |
| Range | 96.9% | 36.6% |
| Mean | 21.2% | 13.3% |
| Median | 13.8% | 12.7% |
| Interquartile 25% (IQ1) | 10.9% | 10.0% |
| Interquartile 75% (IQ3) | 19.4% | 15.5% |
| Interquartile Range (IQR) | 8.6% | 5.5% |
| Standard Deviation (Sample) | 21.0% | 6.3% |
| Standard Deviation (Population) | 20.7% | 6.3% |
Similar Demographics by Female Poverty Among 25-34 Year Olds
Demographics Similar to Moroccans by Female Poverty Among 25-34 Year Olds
In terms of female poverty among 25-34 year olds, the demographic groups most similar to Moroccans are Immigrants from Cambodia (13.9%, a difference of 0.11%), Scottish (13.9%, a difference of 0.16%), Immigrants from Kenya (13.8%, a difference of 0.31%), Tlingit-Haida (13.8%, a difference of 0.32%), and Immigrants from Saudi Arabia (13.9%, a difference of 0.36%).
| Demographics | Rating | Rank | Female Poverty Among 25-34 Year Olds |
| Slovaks | 34.1 /100 | #187 | Fair 13.7% |
| Immigrants | Eritrea | 32.7 /100 | #188 | Fair 13.7% |
| Finns | 32.5 /100 | #189 | Fair 13.7% |
| Dutch | 29.7 /100 | #190 | Fair 13.8% |
| Immigrants | St. Vincent and the Grenadines | 29.3 /100 | #191 | Fair 13.8% |
| Tlingit-Haida | 28.1 /100 | #192 | Fair 13.8% |
| Immigrants | Kenya | 28.0 /100 | #193 | Fair 13.8% |
| Moroccans | 25.1 /100 | #194 | Fair 13.8% |
| Immigrants | Cambodia | 24.0 /100 | #195 | Fair 13.9% |
| Scottish | 23.6 /100 | #196 | Fair 13.9% |
| Immigrants | Saudi Arabia | 21.9 /100 | #197 | Fair 13.9% |
| Immigrants | Germany | 20.9 /100 | #198 | Fair 13.9% |
| English | 20.4 /100 | #199 | Fair 13.9% |
| Hmong | 20.3 /100 | #200 | Fair 13.9% |
| Immigrants | Trinidad and Tobago | 17.6 /100 | #201 | Poor 14.0% |
Demographics Similar to Immigrants from Kazakhstan by Female Poverty Among 25-34 Year Olds
In terms of female poverty among 25-34 year olds, the demographic groups most similar to Immigrants from Kazakhstan are Ethiopian (12.4%, a difference of 0.080%), Immigrants from Malaysia (12.4%, a difference of 0.24%), Albanian (12.5%, a difference of 0.40%), Immigrants from Latvia (12.5%, a difference of 0.46%), and Immigrants from Jordan (12.4%, a difference of 0.51%).
| Demographics | Rating | Rank | Female Poverty Among 25-34 Year Olds |
| Immigrants | Sweden | 98.9 /100 | #74 | Exceptional 12.3% |
| Estonians | 98.9 /100 | #75 | Exceptional 12.3% |
| Greeks | 98.9 /100 | #76 | Exceptional 12.3% |
| Immigrants | Italy | 98.8 /100 | #77 | Exceptional 12.3% |
| Immigrants | Ukraine | 98.6 /100 | #78 | Exceptional 12.3% |
| Immigrants | Jordan | 98.5 /100 | #79 | Exceptional 12.4% |
| Immigrants | Malaysia | 98.3 /100 | #80 | Exceptional 12.4% |
| Immigrants | Kazakhstan | 98.1 /100 | #81 | Exceptional 12.4% |
| Ethiopians | 98.0 /100 | #82 | Exceptional 12.4% |
| Albanians | 97.7 /100 | #83 | Exceptional 12.5% |
| Immigrants | Latvia | 97.7 /100 | #84 | Exceptional 12.5% |
| Immigrants | South Eastern Asia | 97.6 /100 | #85 | Exceptional 12.5% |
| Croatians | 97.5 /100 | #86 | Exceptional 12.5% |
| Argentineans | 97.5 /100 | #87 | Exceptional 12.5% |
| Immigrants | Austria | 97.4 /100 | #88 | Exceptional 12.5% |