Sierra Leonean vs Immigrants from Kazakhstan Female Poverty Among 25-34 Year Olds
COMPARE
Sierra Leonean
Immigrants from Kazakhstan
Female Poverty Among 25-34 Year Olds
Female Poverty Among 25-34 Year Olds Comparison
Sierra Leoneans
Immigrants from Kazakhstan
13.2%
FEMALE POVERTY AMONG 25-34 YEAR OLDS
76.3/ 100
METRIC RATING
149th/ 347
METRIC RANK
12.4%
FEMALE POVERTY AMONG 25-34 YEAR OLDS
98.1/ 100
METRIC RATING
81st/ 347
METRIC RANK
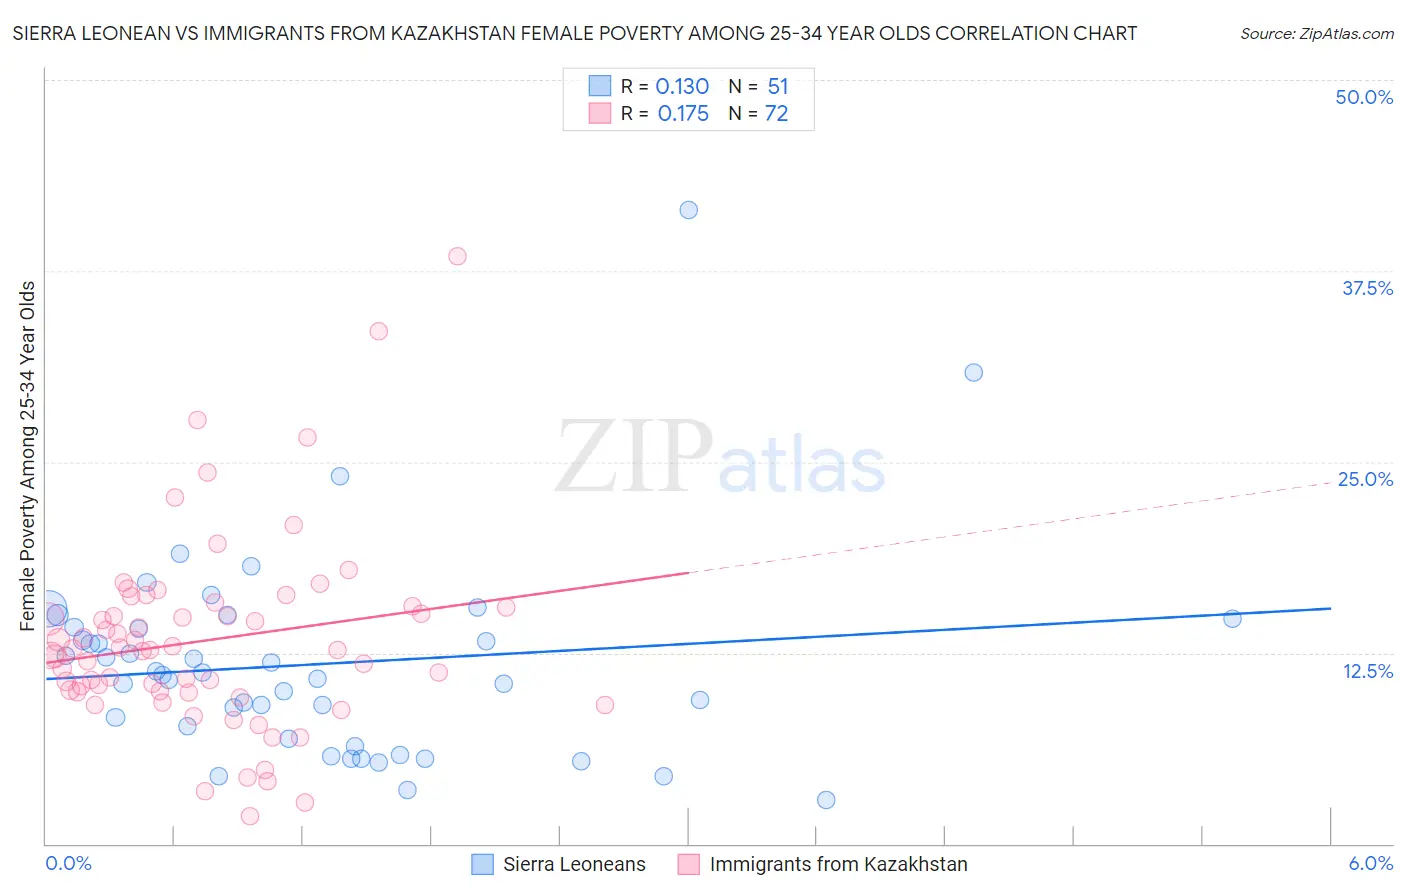
Sierra Leonean vs Immigrants from Kazakhstan Female Poverty Among 25-34 Year Olds Correlation Chart
The statistical analysis conducted on geographies consisting of 83,152,605 people shows a poor positive correlation between the proportion of Sierra Leoneans and poverty level among females between the ages 25 and 34 in the United States with a correlation coefficient (R) of 0.130 and weighted average of 13.2%. Similarly, the statistical analysis conducted on geographies consisting of 123,655,702 people shows a poor positive correlation between the proportion of Immigrants from Kazakhstan and poverty level among females between the ages 25 and 34 in the United States with a correlation coefficient (R) of 0.175 and weighted average of 12.4%, a difference of 6.3%.
Female Poverty Among 25-34 Year Olds Correlation Summary
| Measurement | Sierra Leonean | Immigrants from Kazakhstan |
| Minimum | 2.8% | 1.8% |
| Maximum | 41.5% | 38.5% |
| Range | 38.6% | 36.6% |
| Mean | 11.8% | 13.3% |
| Median | 11.0% | 12.7% |
| Interquartile 25% (IQ1) | 6.9% | 10.0% |
| Interquartile 75% (IQ3) | 14.2% | 15.5% |
| Interquartile Range (IQR) | 7.3% | 5.5% |
| Standard Deviation (Sample) | 6.7% | 6.3% |
| Standard Deviation (Population) | 6.7% | 6.3% |
Similar Demographics by Female Poverty Among 25-34 Year Olds
Demographics Similar to Sierra Leoneans by Female Poverty Among 25-34 Year Olds
In terms of female poverty among 25-34 year olds, the demographic groups most similar to Sierra Leoneans are Iraqi (13.2%, a difference of 0.030%), Costa Rican (13.2%, a difference of 0.050%), Lebanese (13.2%, a difference of 0.060%), Slavic (13.2%, a difference of 0.060%), and European (13.2%, a difference of 0.070%).
| Demographics | Rating | Rank | Female Poverty Among 25-34 Year Olds |
| Scandinavians | 82.3 /100 | #142 | Excellent 13.1% |
| Israelis | 81.9 /100 | #143 | Excellent 13.1% |
| Native Hawaiians | 78.9 /100 | #144 | Good 13.2% |
| Colombians | 77.2 /100 | #145 | Good 13.2% |
| South Americans | 76.9 /100 | #146 | Good 13.2% |
| Europeans | 76.8 /100 | #147 | Good 13.2% |
| Lebanese | 76.8 /100 | #148 | Good 13.2% |
| Sierra Leoneans | 76.3 /100 | #149 | Good 13.2% |
| Iraqis | 76.0 /100 | #150 | Good 13.2% |
| Costa Ricans | 75.8 /100 | #151 | Good 13.2% |
| Slavs | 75.7 /100 | #152 | Good 13.2% |
| Northern Europeans | 73.7 /100 | #153 | Good 13.2% |
| Arabs | 73.5 /100 | #154 | Good 13.2% |
| Immigrants | Sierra Leone | 72.9 /100 | #155 | Good 13.3% |
| Immigrants | Cameroon | 72.0 /100 | #156 | Good 13.3% |
Demographics Similar to Immigrants from Kazakhstan by Female Poverty Among 25-34 Year Olds
In terms of female poverty among 25-34 year olds, the demographic groups most similar to Immigrants from Kazakhstan are Ethiopian (12.4%, a difference of 0.080%), Immigrants from Malaysia (12.4%, a difference of 0.24%), Albanian (12.5%, a difference of 0.40%), Immigrants from Latvia (12.5%, a difference of 0.46%), and Immigrants from Jordan (12.4%, a difference of 0.51%).
| Demographics | Rating | Rank | Female Poverty Among 25-34 Year Olds |
| Immigrants | Sweden | 98.9 /100 | #74 | Exceptional 12.3% |
| Estonians | 98.9 /100 | #75 | Exceptional 12.3% |
| Greeks | 98.9 /100 | #76 | Exceptional 12.3% |
| Immigrants | Italy | 98.8 /100 | #77 | Exceptional 12.3% |
| Immigrants | Ukraine | 98.6 /100 | #78 | Exceptional 12.3% |
| Immigrants | Jordan | 98.5 /100 | #79 | Exceptional 12.4% |
| Immigrants | Malaysia | 98.3 /100 | #80 | Exceptional 12.4% |
| Immigrants | Kazakhstan | 98.1 /100 | #81 | Exceptional 12.4% |
| Ethiopians | 98.0 /100 | #82 | Exceptional 12.4% |
| Albanians | 97.7 /100 | #83 | Exceptional 12.5% |
| Immigrants | Latvia | 97.7 /100 | #84 | Exceptional 12.5% |
| Immigrants | South Eastern Asia | 97.6 /100 | #85 | Exceptional 12.5% |
| Croatians | 97.5 /100 | #86 | Exceptional 12.5% |
| Argentineans | 97.5 /100 | #87 | Exceptional 12.5% |
| Immigrants | Austria | 97.4 /100 | #88 | Exceptional 12.5% |