Russian vs Immigrants from Western Europe Female Poverty Among 25-34 Year Olds
COMPARE
Russian
Immigrants from Western Europe
Female Poverty Among 25-34 Year Olds
Female Poverty Among 25-34 Year Olds Comparison
Russians
Immigrants from Western Europe
12.1%
FEMALE POVERTY AMONG 25-34 YEAR OLDS
99.4/ 100
METRIC RATING
59th/ 347
METRIC RANK
13.3%
FEMALE POVERTY AMONG 25-34 YEAR OLDS
70.3/ 100
METRIC RATING
157th/ 347
METRIC RANK
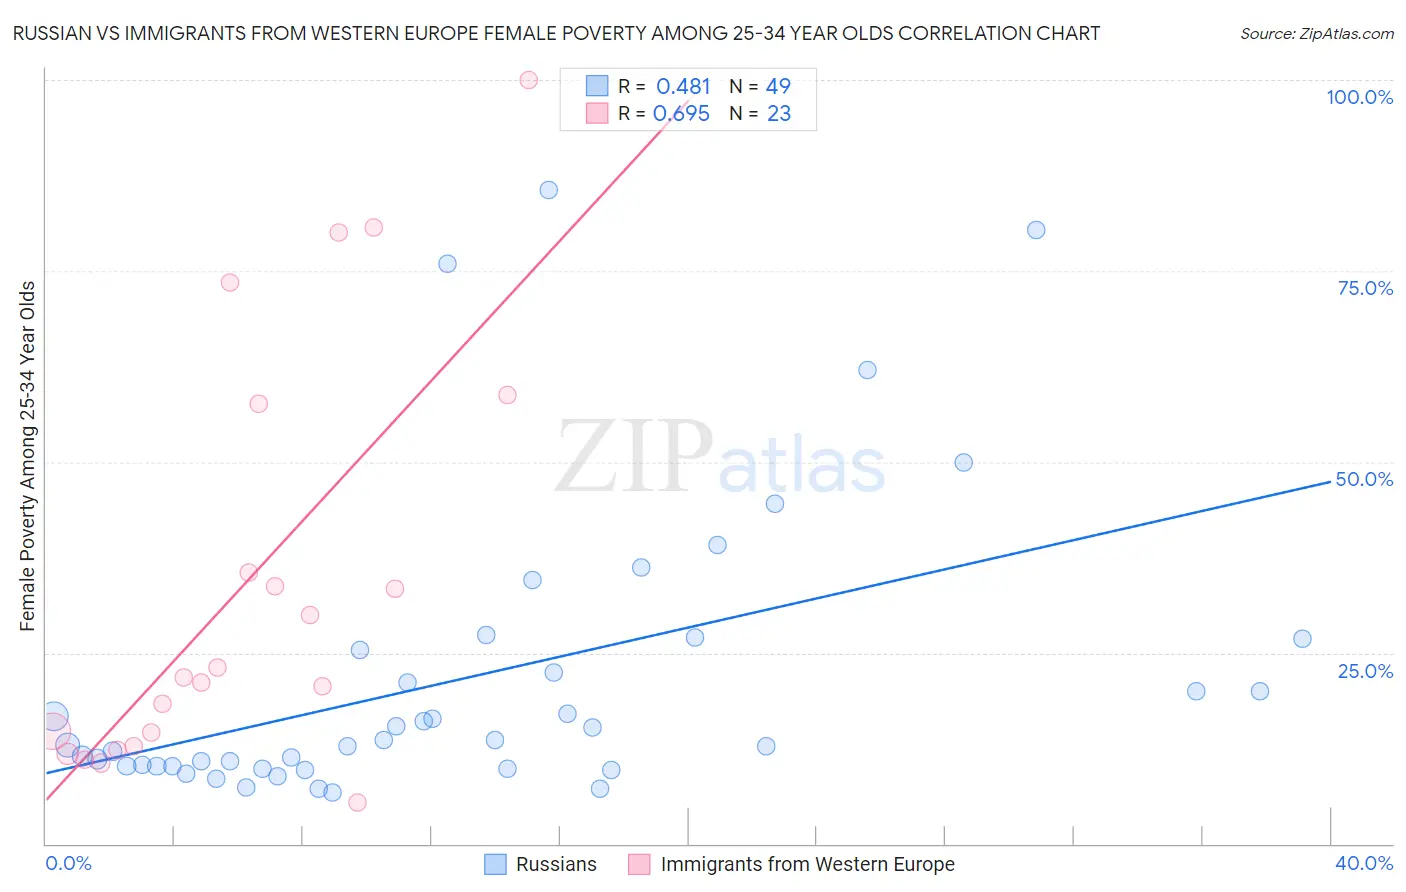
Russian vs Immigrants from Western Europe Female Poverty Among 25-34 Year Olds Correlation Chart
The statistical analysis conducted on geographies consisting of 496,430,751 people shows a moderate positive correlation between the proportion of Russians and poverty level among females between the ages 25 and 34 in the United States with a correlation coefficient (R) of 0.481 and weighted average of 12.1%. Similarly, the statistical analysis conducted on geographies consisting of 481,489,982 people shows a significant positive correlation between the proportion of Immigrants from Western Europe and poverty level among females between the ages 25 and 34 in the United States with a correlation coefficient (R) of 0.695 and weighted average of 13.3%, a difference of 9.9%.
Female Poverty Among 25-34 Year Olds Correlation Summary
| Measurement | Russian | Immigrants from Western Europe |
| Minimum | 6.7% | 5.4% |
| Maximum | 85.5% | 100.0% |
| Range | 78.9% | 94.6% |
| Mean | 21.7% | 34.0% |
| Median | 13.5% | 21.8% |
| Interquartile 25% (IQ1) | 10.1% | 12.8% |
| Interquartile 75% (IQ3) | 26.1% | 57.6% |
| Interquartile Range (IQR) | 16.0% | 44.7% |
| Standard Deviation (Sample) | 19.3% | 27.2% |
| Standard Deviation (Population) | 19.1% | 26.6% |
Similar Demographics by Female Poverty Among 25-34 Year Olds
Demographics Similar to Russians by Female Poverty Among 25-34 Year Olds
In terms of female poverty among 25-34 year olds, the demographic groups most similar to Russians are Immigrants from Romania (12.1%, a difference of 0.0%), Immigrants from Northern Europe (12.1%, a difference of 0.090%), Immigrants from Czechoslovakia (12.1%, a difference of 0.11%), Jordanian (12.1%, a difference of 0.21%), and Luxembourger (12.1%, a difference of 0.23%).
| Demographics | Rating | Rank | Female Poverty Among 25-34 Year Olds |
| Immigrants | Eastern Europe | 99.6 /100 | #52 | Exceptional 12.0% |
| Immigrants | Israel | 99.6 /100 | #53 | Exceptional 12.0% |
| Eastern Europeans | 99.6 /100 | #54 | Exceptional 12.0% |
| Immigrants | Philippines | 99.5 /100 | #55 | Exceptional 12.0% |
| Luxembourgers | 99.5 /100 | #56 | Exceptional 12.1% |
| Jordanians | 99.4 /100 | #57 | Exceptional 12.1% |
| Immigrants | Romania | 99.4 /100 | #58 | Exceptional 12.1% |
| Russians | 99.4 /100 | #59 | Exceptional 12.1% |
| Immigrants | Northern Europe | 99.4 /100 | #60 | Exceptional 12.1% |
| Immigrants | Czechoslovakia | 99.4 /100 | #61 | Exceptional 12.1% |
| Immigrants | Moldova | 99.3 /100 | #62 | Exceptional 12.1% |
| Soviet Union | 99.3 /100 | #63 | Exceptional 12.1% |
| Immigrants | Russia | 99.2 /100 | #64 | Exceptional 12.2% |
| Armenians | 99.2 /100 | #65 | Exceptional 12.2% |
| Immigrants | Europe | 99.2 /100 | #66 | Exceptional 12.2% |
Demographics Similar to Immigrants from Western Europe by Female Poverty Among 25-34 Year Olds
In terms of female poverty among 25-34 year olds, the demographic groups most similar to Immigrants from Western Europe are Immigrants from Colombia (13.3%, a difference of 0.11%), Immigrants from Cameroon (13.3%, a difference of 0.17%), Immigrants from Sierra Leone (13.3%, a difference of 0.27%), Arab (13.2%, a difference of 0.33%), and Uruguayan (13.3%, a difference of 0.33%).
| Demographics | Rating | Rank | Female Poverty Among 25-34 Year Olds |
| Iraqis | 76.0 /100 | #150 | Good 13.2% |
| Costa Ricans | 75.8 /100 | #151 | Good 13.2% |
| Slavs | 75.7 /100 | #152 | Good 13.2% |
| Northern Europeans | 73.7 /100 | #153 | Good 13.2% |
| Arabs | 73.5 /100 | #154 | Good 13.2% |
| Immigrants | Sierra Leone | 72.9 /100 | #155 | Good 13.3% |
| Immigrants | Cameroon | 72.0 /100 | #156 | Good 13.3% |
| Immigrants | Western Europe | 70.3 /100 | #157 | Good 13.3% |
| Immigrants | Colombia | 69.2 /100 | #158 | Good 13.3% |
| Uruguayans | 66.9 /100 | #159 | Good 13.3% |
| Immigrants | South America | 66.3 /100 | #160 | Good 13.3% |
| Icelanders | 65.7 /100 | #161 | Good 13.3% |
| Ugandans | 64.1 /100 | #162 | Good 13.4% |
| British | 63.5 /100 | #163 | Good 13.4% |
| Swiss | 61.7 /100 | #164 | Good 13.4% |