Russian vs Czechoslovakian Child Poverty Under the Age of 16
COMPARE
Russian
Czechoslovakian
Child Poverty Under the Age of 16
Child Poverty Under the Age of 16 Comparison
Russians
Czechoslovakians
13.5%
CHILD POVERTY UNDER THE AGE OF 16
99.6/ 100
METRIC RATING
34th/ 347
METRIC RANK
15.1%
CHILD POVERTY UNDER THE AGE OF 16
91.0/ 100
METRIC RATING
124th/ 347
METRIC RANK
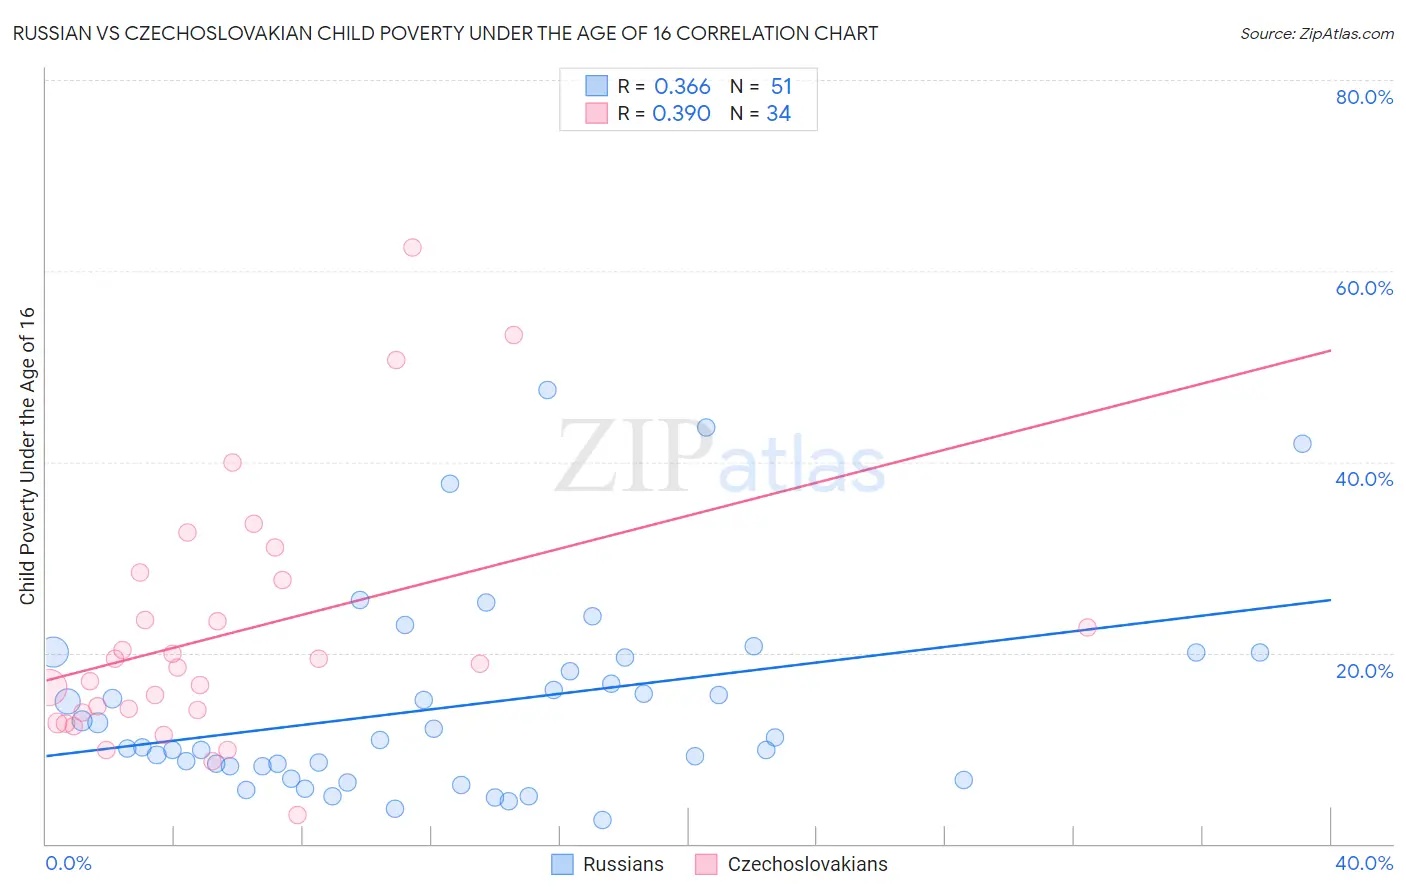
Russian vs Czechoslovakian Child Poverty Under the Age of 16 Correlation Chart
The statistical analysis conducted on geographies consisting of 502,911,881 people shows a mild positive correlation between the proportion of Russians and poverty level among children under the age of 16 in the United States with a correlation coefficient (R) of 0.366 and weighted average of 13.5%. Similarly, the statistical analysis conducted on geographies consisting of 364,841,807 people shows a mild positive correlation between the proportion of Czechoslovakians and poverty level among children under the age of 16 in the United States with a correlation coefficient (R) of 0.390 and weighted average of 15.1%, a difference of 11.6%.
Child Poverty Under the Age of 16 Correlation Summary
| Measurement | Russian | Czechoslovakian |
| Minimum | 2.4% | 3.0% |
| Maximum | 47.5% | 62.5% |
| Range | 45.0% | 59.5% |
| Mean | 14.4% | 22.0% |
| Median | 10.8% | 18.6% |
| Interquartile 25% (IQ1) | 8.1% | 13.7% |
| Interquartile 75% (IQ3) | 19.4% | 27.6% |
| Interquartile Range (IQR) | 11.4% | 13.9% |
| Standard Deviation (Sample) | 10.3% | 13.3% |
| Standard Deviation (Population) | 10.2% | 13.1% |
Similar Demographics by Child Poverty Under the Age of 16
Demographics Similar to Russians by Child Poverty Under the Age of 16
In terms of child poverty under the age of 16, the demographic groups most similar to Russians are Lithuanian (13.5%, a difference of 0.20%), Asian (13.5%, a difference of 0.28%), Immigrants from Northern Europe (13.6%, a difference of 0.44%), Immigrants from Bolivia (13.6%, a difference of 0.46%), and Tongan (13.4%, a difference of 0.76%).
| Demographics | Rating | Rank | Child Poverty Under the Age of 16 |
| Immigrants | China | 99.8 /100 | #27 | Exceptional 13.3% |
| Assyrians/Chaldeans/Syriacs | 99.7 /100 | #28 | Exceptional 13.3% |
| Swedes | 99.7 /100 | #29 | Exceptional 13.3% |
| Turks | 99.7 /100 | #30 | Exceptional 13.4% |
| Danes | 99.7 /100 | #31 | Exceptional 13.4% |
| Tongans | 99.7 /100 | #32 | Exceptional 13.4% |
| Asians | 99.6 /100 | #33 | Exceptional 13.5% |
| Russians | 99.6 /100 | #34 | Exceptional 13.5% |
| Lithuanians | 99.6 /100 | #35 | Exceptional 13.5% |
| Immigrants | Northern Europe | 99.6 /100 | #36 | Exceptional 13.6% |
| Immigrants | Bolivia | 99.6 /100 | #37 | Exceptional 13.6% |
| Luxembourgers | 99.5 /100 | #38 | Exceptional 13.6% |
| Immigrants | Australia | 99.5 /100 | #39 | Exceptional 13.6% |
| Immigrants | Scotland | 99.4 /100 | #40 | Exceptional 13.7% |
| Croatians | 99.4 /100 | #41 | Exceptional 13.8% |
Demographics Similar to Czechoslovakians by Child Poverty Under the Age of 16
In terms of child poverty under the age of 16, the demographic groups most similar to Czechoslovakians are Immigrants from Brazil (15.1%, a difference of 0.0%), Palestinian (15.1%, a difference of 0.040%), Portuguese (15.1%, a difference of 0.18%), Pakistani (15.0%, a difference of 0.25%), and Immigrants from Western Europe (15.1%, a difference of 0.27%).
| Demographics | Rating | Rank | Child Poverty Under the Age of 16 |
| Immigrants | Norway | 92.8 /100 | #117 | Exceptional 15.0% |
| Immigrants | Malaysia | 92.6 /100 | #118 | Exceptional 15.0% |
| Scottish | 92.3 /100 | #119 | Exceptional 15.0% |
| South Africans | 92.1 /100 | #120 | Exceptional 15.0% |
| Immigrants | Zimbabwe | 92.1 /100 | #121 | Exceptional 15.0% |
| Pakistanis | 91.7 /100 | #122 | Exceptional 15.0% |
| Immigrants | Brazil | 91.1 /100 | #123 | Exceptional 15.1% |
| Czechoslovakians | 91.0 /100 | #124 | Exceptional 15.1% |
| Palestinians | 90.9 /100 | #125 | Exceptional 15.1% |
| Portuguese | 90.6 /100 | #126 | Exceptional 15.1% |
| Immigrants | Western Europe | 90.3 /100 | #127 | Exceptional 15.1% |
| Immigrants | Kazakhstan | 90.2 /100 | #128 | Exceptional 15.1% |
| Immigrants | Southern Europe | 89.7 /100 | #129 | Excellent 15.1% |
| Mongolians | 89.5 /100 | #130 | Excellent 15.2% |
| Armenians | 89.4 /100 | #131 | Excellent 15.2% |