Immigrants from Colombia vs Delaware Female Poverty Among 18-24 Year Olds
COMPARE
Immigrants from Colombia
Delaware
Female Poverty Among 18-24 Year Olds
Female Poverty Among 18-24 Year Olds Comparison
Immigrants from Colombia
Delaware
17.3%
FEMALE POVERTY AMONG 18-24 YEAR OLDS
100.0/ 100
METRIC RATING
18th/ 347
METRIC RANK
21.1%
FEMALE POVERTY AMONG 18-24 YEAR OLDS
1.6/ 100
METRIC RATING
253rd/ 347
METRIC RANK
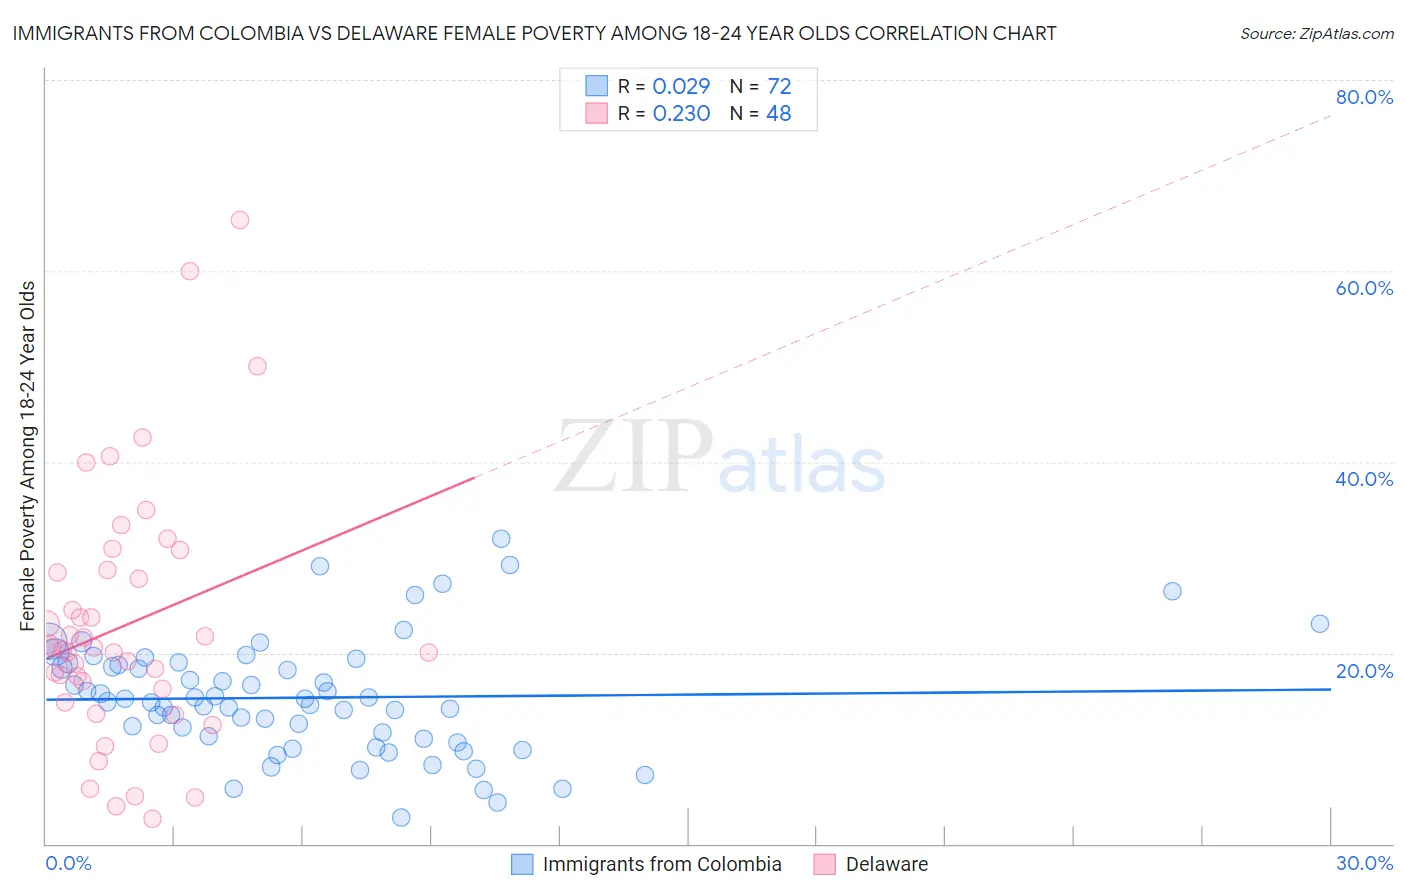
Immigrants from Colombia vs Delaware Female Poverty Among 18-24 Year Olds Correlation Chart
The statistical analysis conducted on geographies consisting of 369,842,642 people shows no correlation between the proportion of Immigrants from Colombia and poverty level among females between the ages 18 and 24 in the United States with a correlation coefficient (R) of 0.029 and weighted average of 17.3%. Similarly, the statistical analysis conducted on geographies consisting of 95,183,522 people shows a weak positive correlation between the proportion of Delaware and poverty level among females between the ages 18 and 24 in the United States with a correlation coefficient (R) of 0.230 and weighted average of 21.1%, a difference of 21.8%.
Female Poverty Among 18-24 Year Olds Correlation Summary
| Measurement | Immigrants from Colombia | Delaware |
| Minimum | 2.8% | 2.6% |
| Maximum | 32.0% | 65.4% |
| Range | 29.2% | 62.8% |
| Mean | 15.3% | 22.8% |
| Median | 15.0% | 20.4% |
| Interquartile 25% (IQ1) | 11.2% | 15.5% |
| Interquartile 75% (IQ3) | 18.9% | 28.5% |
| Interquartile Range (IQR) | 7.7% | 13.0% |
| Standard Deviation (Sample) | 6.0% | 13.3% |
| Standard Deviation (Population) | 6.0% | 13.1% |
Similar Demographics by Female Poverty Among 18-24 Year Olds
Demographics Similar to Immigrants from Colombia by Female Poverty Among 18-24 Year Olds
In terms of female poverty among 18-24 year olds, the demographic groups most similar to Immigrants from Colombia are Immigrants from Lithuania (17.4%, a difference of 0.41%), Immigrants from Taiwan (17.3%, a difference of 0.46%), Immigrants from Venezuela (17.4%, a difference of 0.54%), Bolivian (17.4%, a difference of 0.54%), and Immigrants from Hong Kong (17.5%, a difference of 0.64%).
| Demographics | Rating | Rank | Female Poverty Among 18-24 Year Olds |
| Thais | 100.0 /100 | #11 | Exceptional 17.0% |
| Immigrants | Pakistan | 100.0 /100 | #12 | Exceptional 17.0% |
| Immigrants | Poland | 100.0 /100 | #13 | Exceptional 17.1% |
| Tongans | 100.0 /100 | #14 | Exceptional 17.1% |
| Cubans | 100.0 /100 | #15 | Exceptional 17.2% |
| Peruvians | 100.0 /100 | #16 | Exceptional 17.2% |
| Immigrants | Taiwan | 100.0 /100 | #17 | Exceptional 17.3% |
| Immigrants | Colombia | 100.0 /100 | #18 | Exceptional 17.3% |
| Immigrants | Lithuania | 100.0 /100 | #19 | Exceptional 17.4% |
| Immigrants | Venezuela | 100.0 /100 | #20 | Exceptional 17.4% |
| Bolivians | 100.0 /100 | #21 | Exceptional 17.4% |
| Immigrants | Hong Kong | 100.0 /100 | #22 | Exceptional 17.5% |
| Immigrants | North Macedonia | 100.0 /100 | #23 | Exceptional 17.6% |
| Maltese | 100.0 /100 | #24 | Exceptional 17.6% |
| Immigrants | South Central Asia | 100.0 /100 | #25 | Exceptional 17.6% |
Demographics Similar to Delaware by Female Poverty Among 18-24 Year Olds
In terms of female poverty among 18-24 year olds, the demographic groups most similar to Delaware are South African (21.1%, a difference of 0.040%), West Indian (21.1%, a difference of 0.23%), British West Indian (21.2%, a difference of 0.29%), Immigrants from Grenada (21.2%, a difference of 0.32%), and Immigrants from West Indies (21.0%, a difference of 0.43%).
| Demographics | Rating | Rank | Female Poverty Among 18-24 Year Olds |
| Immigrants | Australia | 3.1 /100 | #246 | Tragic 20.9% |
| Immigrants | Africa | 3.0 /100 | #247 | Tragic 21.0% |
| Immigrants | Kenya | 2.5 /100 | #248 | Tragic 21.0% |
| Carpatho Rusyns | 2.5 /100 | #249 | Tragic 21.0% |
| Immigrants | West Indies | 2.2 /100 | #250 | Tragic 21.0% |
| West Indians | 1.9 /100 | #251 | Tragic 21.1% |
| South Africans | 1.6 /100 | #252 | Tragic 21.1% |
| Delaware | 1.6 /100 | #253 | Tragic 21.1% |
| British West Indians | 1.2 /100 | #254 | Tragic 21.2% |
| Immigrants | Grenada | 1.2 /100 | #255 | Tragic 21.2% |
| Tsimshian | 1.0 /100 | #256 | Tragic 21.2% |
| Taiwanese | 1.0 /100 | #257 | Tragic 21.2% |
| Vietnamese | 0.6 /100 | #258 | Tragic 21.4% |
| Immigrants | France | 0.6 /100 | #259 | Tragic 21.4% |
| Immigrants | Norway | 0.6 /100 | #260 | Tragic 21.4% |