Brazilian vs Barbadian Female Poverty Among 18-24 Year Olds
COMPARE
Brazilian
Barbadian
Female Poverty Among 18-24 Year Olds
Female Poverty Among 18-24 Year Olds Comparison
Brazilians
Barbadians
18.6%
FEMALE POVERTY AMONG 18-24 YEAR OLDS
99.8/ 100
METRIC RATING
68th/ 347
METRIC RANK
20.7%
FEMALE POVERTY AMONG 18-24 YEAR OLDS
9.0/ 100
METRIC RATING
221st/ 347
METRIC RANK
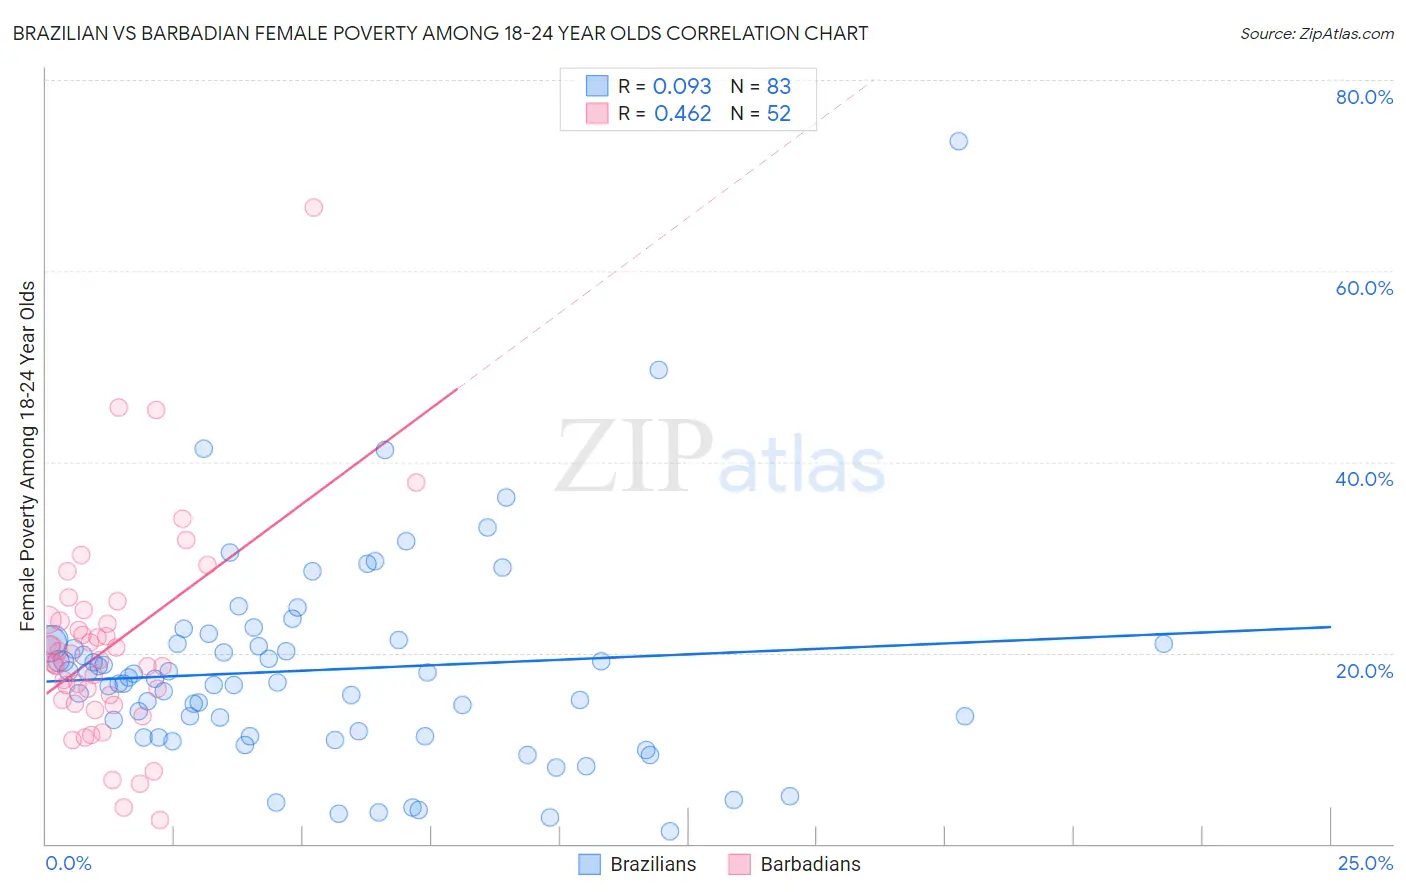
Brazilian vs Barbadian Female Poverty Among 18-24 Year Olds Correlation Chart
The statistical analysis conducted on geographies consisting of 317,615,772 people shows a slight positive correlation between the proportion of Brazilians and poverty level among females between the ages 18 and 24 in the United States with a correlation coefficient (R) of 0.093 and weighted average of 18.6%. Similarly, the statistical analysis conducted on geographies consisting of 140,037,273 people shows a moderate positive correlation between the proportion of Barbadians and poverty level among females between the ages 18 and 24 in the United States with a correlation coefficient (R) of 0.462 and weighted average of 20.7%, a difference of 11.0%.
Female Poverty Among 18-24 Year Olds Correlation Summary
| Measurement | Brazilian | Barbadian |
| Minimum | 1.3% | 2.5% |
| Maximum | 73.5% | 66.7% |
| Range | 72.2% | 64.2% |
| Mean | 18.2% | 20.7% |
| Median | 17.3% | 19.1% |
| Interquartile 25% (IQ1) | 11.3% | 14.9% |
| Interquartile 75% (IQ3) | 21.0% | 23.4% |
| Interquartile Range (IQR) | 9.7% | 8.5% |
| Standard Deviation (Sample) | 10.9% | 11.0% |
| Standard Deviation (Population) | 10.8% | 10.9% |
Similar Demographics by Female Poverty Among 18-24 Year Olds
Demographics Similar to Brazilians by Female Poverty Among 18-24 Year Olds
In terms of female poverty among 18-24 year olds, the demographic groups most similar to Brazilians are Immigrants from Korea (18.6%, a difference of 0.030%), Immigrants from Bulgaria (18.6%, a difference of 0.12%), Jordanian (18.6%, a difference of 0.21%), Immigrants from Costa Rica (18.7%, a difference of 0.22%), and Immigrants from Haiti (18.7%, a difference of 0.29%).
| Demographics | Rating | Rank | Female Poverty Among 18-24 Year Olds |
| Immigrants | Albania | 99.8 /100 | #61 | Exceptional 18.5% |
| Greeks | 99.8 /100 | #62 | Exceptional 18.5% |
| Immigrants | Belarus | 99.8 /100 | #63 | Exceptional 18.5% |
| Immigrants | Asia | 99.8 /100 | #64 | Exceptional 18.6% |
| Immigrants | Scotland | 99.8 /100 | #65 | Exceptional 18.6% |
| Jordanians | 99.8 /100 | #66 | Exceptional 18.6% |
| Immigrants | Korea | 99.8 /100 | #67 | Exceptional 18.6% |
| Brazilians | 99.8 /100 | #68 | Exceptional 18.6% |
| Immigrants | Bulgaria | 99.7 /100 | #69 | Exceptional 18.6% |
| Immigrants | Costa Rica | 99.7 /100 | #70 | Exceptional 18.7% |
| Immigrants | Haiti | 99.7 /100 | #71 | Exceptional 18.7% |
| Armenians | 99.7 /100 | #72 | Exceptional 18.7% |
| Lithuanians | 99.7 /100 | #73 | Exceptional 18.7% |
| Hawaiians | 99.6 /100 | #74 | Exceptional 18.7% |
| Poles | 99.6 /100 | #75 | Exceptional 18.8% |
Demographics Similar to Barbadians by Female Poverty Among 18-24 Year Olds
In terms of female poverty among 18-24 year olds, the demographic groups most similar to Barbadians are British (20.7%, a difference of 0.070%), Immigrants from Micronesia (20.7%, a difference of 0.090%), Immigrants from Nepal (20.7%, a difference of 0.10%), Immigrants from Laos (20.6%, a difference of 0.11%), and Guatemalan (20.7%, a difference of 0.14%).
| Demographics | Rating | Rank | Female Poverty Among 18-24 Year Olds |
| Immigrants | South Africa | 10.7 /100 | #214 | Poor 20.6% |
| Spanish | 10.4 /100 | #215 | Poor 20.6% |
| Immigrants | Western Africa | 10.2 /100 | #216 | Poor 20.6% |
| Immigrants | Laos | 9.7 /100 | #217 | Tragic 20.6% |
| Immigrants | Nepal | 9.6 /100 | #218 | Tragic 20.7% |
| Immigrants | Micronesia | 9.6 /100 | #219 | Tragic 20.7% |
| British | 9.4 /100 | #220 | Tragic 20.7% |
| Barbadians | 9.0 /100 | #221 | Tragic 20.7% |
| Guatemalans | 8.1 /100 | #222 | Tragic 20.7% |
| French | 7.9 /100 | #223 | Tragic 20.7% |
| Immigrants | Liberia | 7.6 /100 | #224 | Tragic 20.7% |
| Norwegians | 7.3 /100 | #225 | Tragic 20.7% |
| Estonians | 7.2 /100 | #226 | Tragic 20.7% |
| Immigrants | Sweden | 6.8 /100 | #227 | Tragic 20.7% |
| Ghanaians | 6.5 /100 | #228 | Tragic 20.8% |