Puerto Rican vs American Single Father Poverty
COMPARE
Puerto Rican
American
Single Father Poverty
Single Father Poverty Comparison
Puerto Ricans
Americans
31.5%
SINGLE FATHER POVERTY
0.0/ 100
METRIC RATING
346th/ 347
METRIC RANK
20.1%
SINGLE FATHER POVERTY
0.0/ 100
METRIC RATING
324th/ 347
METRIC RANK
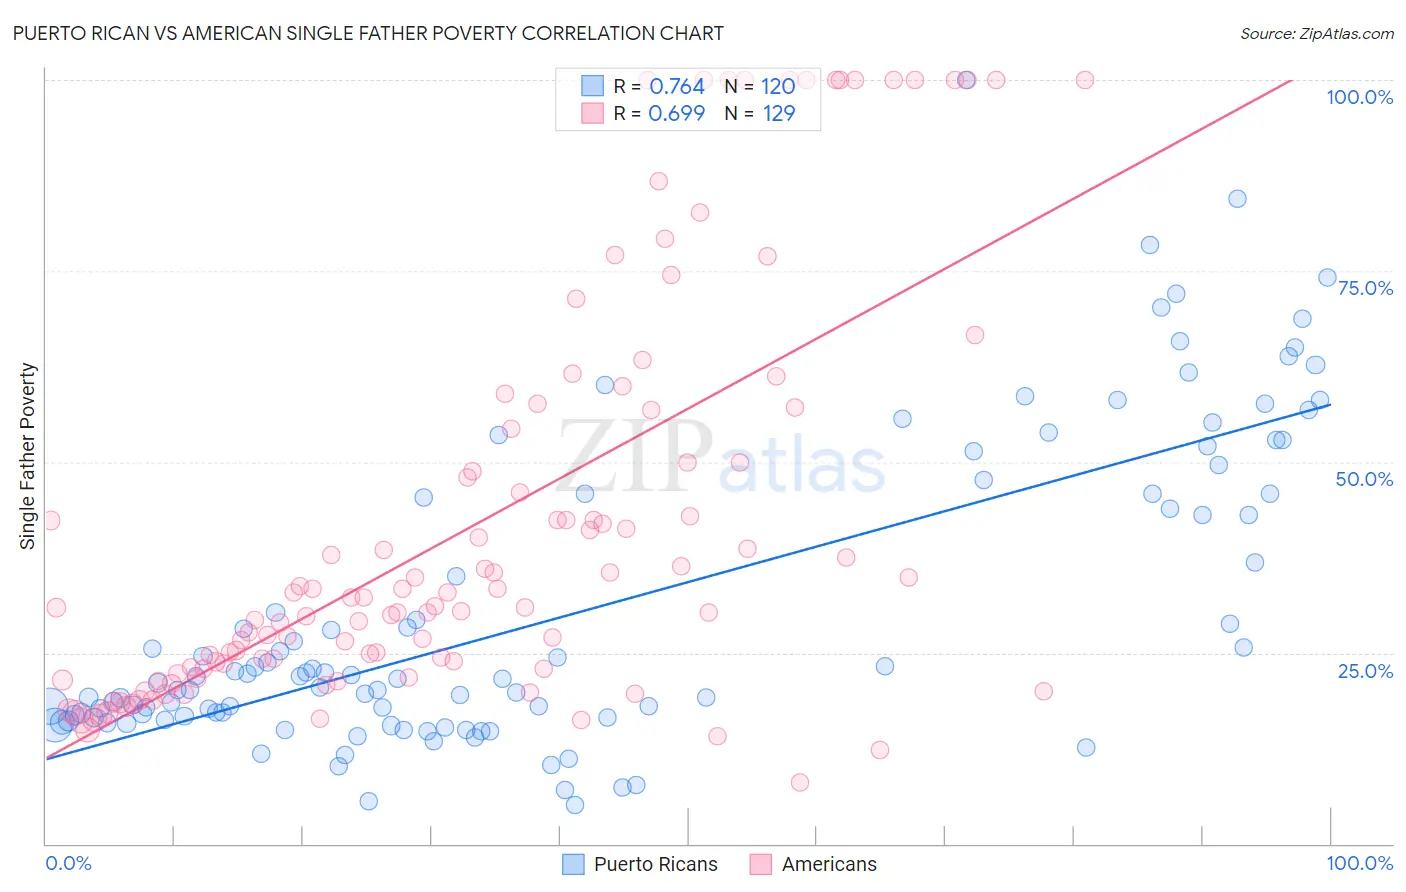
Puerto Rican vs American Single Father Poverty Correlation Chart
The statistical analysis conducted on geographies consisting of 394,843,962 people shows a strong positive correlation between the proportion of Puerto Ricans and poverty level among single fathers in the United States with a correlation coefficient (R) of 0.764 and weighted average of 31.5%. Similarly, the statistical analysis conducted on geographies consisting of 414,003,913 people shows a significant positive correlation between the proportion of Americans and poverty level among single fathers in the United States with a correlation coefficient (R) of 0.699 and weighted average of 20.1%, a difference of 57.1%.
Single Father Poverty Correlation Summary
| Measurement | Puerto Rican | American |
| Minimum | 5.1% | 8.0% |
| Maximum | 100.0% | 100.0% |
| Range | 94.9% | 92.0% |
| Mean | 30.4% | 41.6% |
| Median | 21.8% | 31.1% |
| Interquartile 25% (IQ1) | 16.6% | 22.6% |
| Interquartile 75% (IQ3) | 45.8% | 52.2% |
| Interquartile Range (IQR) | 29.2% | 29.6% |
| Standard Deviation (Sample) | 20.1% | 26.6% |
| Standard Deviation (Population) | 20.0% | 26.5% |
Similar Demographics by Single Father Poverty
Demographics Similar to Puerto Ricans by Single Father Poverty
In terms of single father poverty, the demographic groups most similar to Puerto Ricans are Yup'ik (32.5%, a difference of 3.2%), Crow (30.3%, a difference of 4.1%), Navajo (29.2%, a difference of 7.9%), Lumbee (28.5%, a difference of 10.7%), and Yuman (28.4%, a difference of 11.0%).
| Demographics | Rating | Rank | Single Father Poverty |
| Natives/Alaskans | 0.0 /100 | #333 | Tragic 22.4% |
| Kiowa | 0.0 /100 | #334 | Tragic 22.5% |
| Shoshone | 0.0 /100 | #335 | Tragic 22.9% |
| Cajuns | 0.0 /100 | #336 | Tragic 23.1% |
| Sioux | 0.0 /100 | #337 | Tragic 23.9% |
| Arapaho | 0.0 /100 | #338 | Tragic 24.0% |
| Apache | 0.0 /100 | #339 | Tragic 24.2% |
| Houma | 0.0 /100 | #340 | Tragic 26.7% |
| Hopi | 0.0 /100 | #341 | Tragic 27.2% |
| Yuman | 0.0 /100 | #342 | Tragic 28.4% |
| Lumbee | 0.0 /100 | #343 | Tragic 28.5% |
| Navajo | 0.0 /100 | #344 | Tragic 29.2% |
| Crow | 0.0 /100 | #345 | Tragic 30.3% |
| Puerto Ricans | 0.0 /100 | #346 | Tragic 31.5% |
| Yup'ik | 0.0 /100 | #347 | Tragic 32.5% |
Demographics Similar to Americans by Single Father Poverty
In terms of single father poverty, the demographic groups most similar to Americans are Pennsylvania German (20.0%, a difference of 0.22%), Creek (19.8%, a difference of 1.1%), Black/African American (20.4%, a difference of 1.6%), Cherokee (19.6%, a difference of 2.1%), and Immigrants from Yemen (20.6%, a difference of 2.6%).
| Demographics | Rating | Rank | Single Father Poverty |
| Dominicans | 0.0 /100 | #317 | Tragic 19.1% |
| Dutch West Indians | 0.0 /100 | #318 | Tragic 19.2% |
| Slovaks | 0.0 /100 | #319 | Tragic 19.3% |
| Inupiat | 0.0 /100 | #320 | Tragic 19.5% |
| Cherokee | 0.0 /100 | #321 | Tragic 19.6% |
| Creek | 0.0 /100 | #322 | Tragic 19.8% |
| Pennsylvania Germans | 0.0 /100 | #323 | Tragic 20.0% |
| Americans | 0.0 /100 | #324 | Tragic 20.1% |
| Blacks/African Americans | 0.0 /100 | #325 | Tragic 20.4% |
| Immigrants | Yemen | 0.0 /100 | #326 | Tragic 20.6% |
| Choctaw | 0.0 /100 | #327 | Tragic 20.7% |
| Pueblo | 0.0 /100 | #328 | Tragic 21.1% |
| Colville | 0.0 /100 | #329 | Tragic 21.4% |
| Paiute | 0.0 /100 | #330 | Tragic 21.6% |
| Central American Indians | 0.0 /100 | #331 | Tragic 21.7% |