Immigrants from Ghana vs Blackfeet Male Poverty
COMPARE
Immigrants from Ghana
Blackfeet
Male Poverty
Male Poverty Comparison
Immigrants from Ghana
Blackfeet
12.9%
MALE POVERTY
0.2/ 100
METRIC RATING
253rd/ 347
METRIC RANK
14.0%
MALE POVERTY
0.0/ 100
METRIC RATING
298th/ 347
METRIC RANK
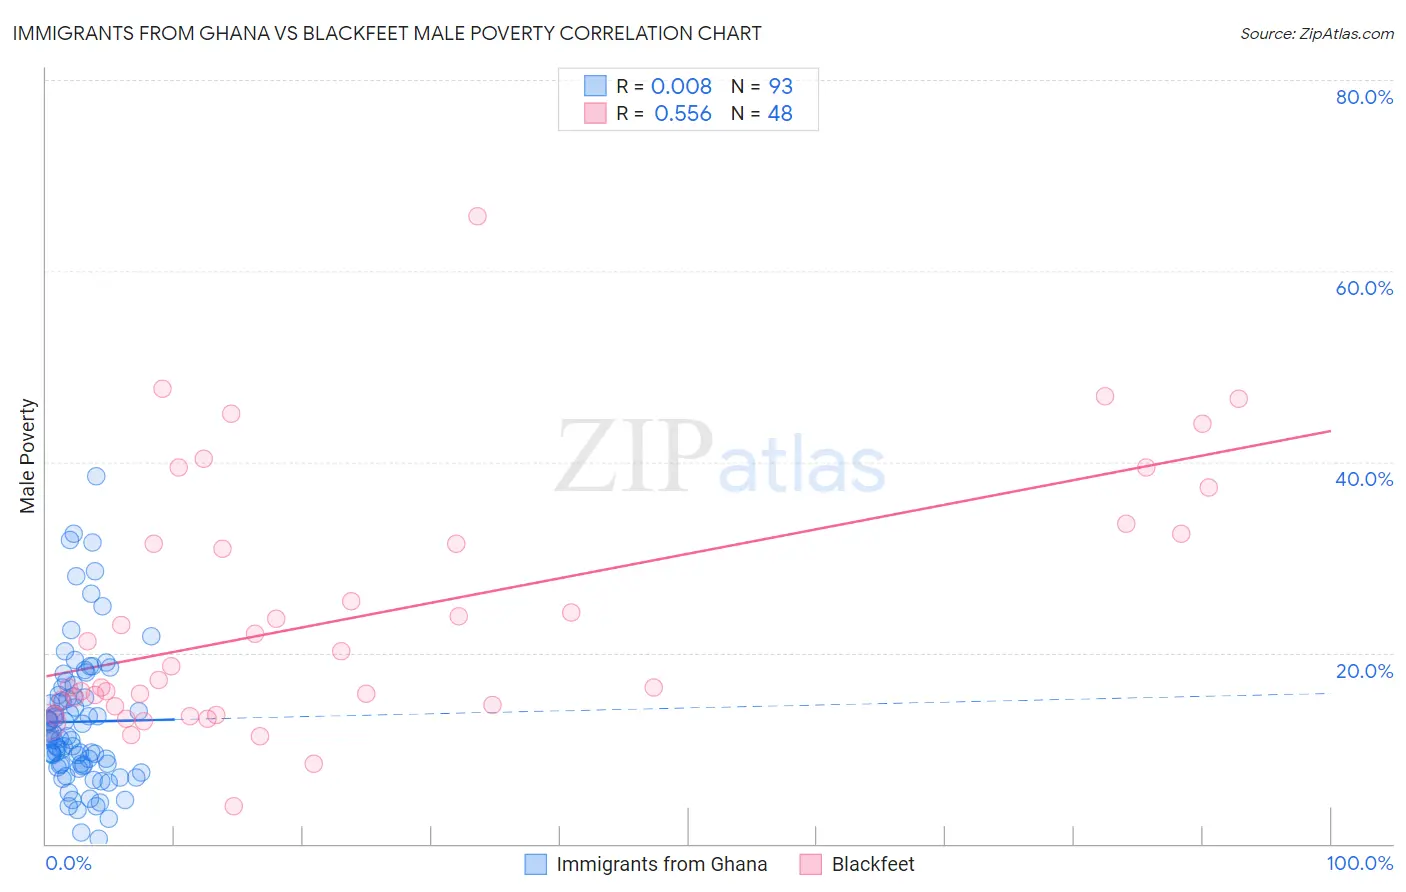
Immigrants from Ghana vs Blackfeet Male Poverty Correlation Chart
The statistical analysis conducted on geographies consisting of 199,744,013 people shows no correlation between the proportion of Immigrants from Ghana and poverty level among males in the United States with a correlation coefficient (R) of 0.008 and weighted average of 12.9%. Similarly, the statistical analysis conducted on geographies consisting of 309,436,017 people shows a substantial positive correlation between the proportion of Blackfeet and poverty level among males in the United States with a correlation coefficient (R) of 0.556 and weighted average of 14.0%, a difference of 8.3%.
Male Poverty Correlation Summary
| Measurement | Immigrants from Ghana | Blackfeet |
| Minimum | 0.51% | 3.9% |
| Maximum | 38.5% | 65.7% |
| Range | 38.0% | 61.8% |
| Mean | 12.8% | 23.9% |
| Median | 11.3% | 17.9% |
| Interquartile 25% (IQ1) | 8.3% | 14.4% |
| Interquartile 75% (IQ3) | 15.5% | 31.9% |
| Interquartile Range (IQR) | 7.2% | 17.5% |
| Standard Deviation (Sample) | 7.2% | 13.2% |
| Standard Deviation (Population) | 7.1% | 13.0% |
Similar Demographics by Male Poverty
Demographics Similar to Immigrants from Ghana by Male Poverty
In terms of male poverty, the demographic groups most similar to Immigrants from Ghana are Immigrants from Ecuador (12.9%, a difference of 0.050%), Immigrants from Cuba (12.9%, a difference of 0.080%), Immigrants from Nicaragua (12.9%, a difference of 0.18%), Potawatomi (12.9%, a difference of 0.19%), and Immigrants from Sudan (12.9%, a difference of 0.27%).
| Demographics | Rating | Rank | Male Poverty |
| Immigrants | El Salvador | 0.2 /100 | #246 | Tragic 12.8% |
| Immigrants | Western Africa | 0.2 /100 | #247 | Tragic 12.9% |
| Immigrants | Sudan | 0.2 /100 | #248 | Tragic 12.9% |
| Potawatomi | 0.2 /100 | #249 | Tragic 12.9% |
| Immigrants | Nicaragua | 0.2 /100 | #250 | Tragic 12.9% |
| Immigrants | Cuba | 0.2 /100 | #251 | Tragic 12.9% |
| Immigrants | Ecuador | 0.2 /100 | #252 | Tragic 12.9% |
| Immigrants | Ghana | 0.2 /100 | #253 | Tragic 12.9% |
| Mexican American Indians | 0.1 /100 | #254 | Tragic 13.0% |
| Immigrants | Liberia | 0.1 /100 | #255 | Tragic 13.0% |
| Immigrants | Burma/Myanmar | 0.1 /100 | #256 | Tragic 13.0% |
| Immigrants | Trinidad and Tobago | 0.1 /100 | #257 | Tragic 13.1% |
| Cape Verdeans | 0.1 /100 | #258 | Tragic 13.1% |
| Cherokee | 0.1 /100 | #259 | Tragic 13.1% |
| Ottawa | 0.1 /100 | #260 | Tragic 13.1% |
Demographics Similar to Blackfeet by Male Poverty
In terms of male poverty, the demographic groups most similar to Blackfeet are Inupiat (14.0%, a difference of 0.030%), Immigrants from Guatemala (14.0%, a difference of 0.10%), Immigrants from Mexico (14.0%, a difference of 0.22%), Immigrants from Senegal (14.0%, a difference of 0.29%), and Immigrants from Caribbean (14.0%, a difference of 0.34%).
| Demographics | Rating | Rank | Male Poverty |
| Vietnamese | 0.0 /100 | #291 | Tragic 13.8% |
| Indonesians | 0.0 /100 | #292 | Tragic 13.8% |
| Immigrants | Belize | 0.0 /100 | #293 | Tragic 13.8% |
| Hispanics or Latinos | 0.0 /100 | #294 | Tragic 13.9% |
| Immigrants | Central America | 0.0 /100 | #295 | Tragic 13.9% |
| Cajuns | 0.0 /100 | #296 | Tragic 13.9% |
| Inupiat | 0.0 /100 | #297 | Tragic 14.0% |
| Blackfeet | 0.0 /100 | #298 | Tragic 14.0% |
| Immigrants | Guatemala | 0.0 /100 | #299 | Tragic 14.0% |
| Immigrants | Mexico | 0.0 /100 | #300 | Tragic 14.0% |
| Immigrants | Senegal | 0.0 /100 | #301 | Tragic 14.0% |
| Immigrants | Caribbean | 0.0 /100 | #302 | Tragic 14.0% |
| Bahamians | 0.0 /100 | #303 | Tragic 14.1% |
| Senegalese | 0.0 /100 | #304 | Tragic 14.1% |
| Immigrants | Bangladesh | 0.0 /100 | #305 | Tragic 14.1% |