Swedish vs Blackfeet Male Poverty
COMPARE
Swedish
Blackfeet
Male Poverty
Male Poverty Comparison
Swedes
Blackfeet
9.6%
MALE POVERTY
99.7/ 100
METRIC RATING
24th/ 347
METRIC RANK
14.0%
MALE POVERTY
0.0/ 100
METRIC RATING
298th/ 347
METRIC RANK
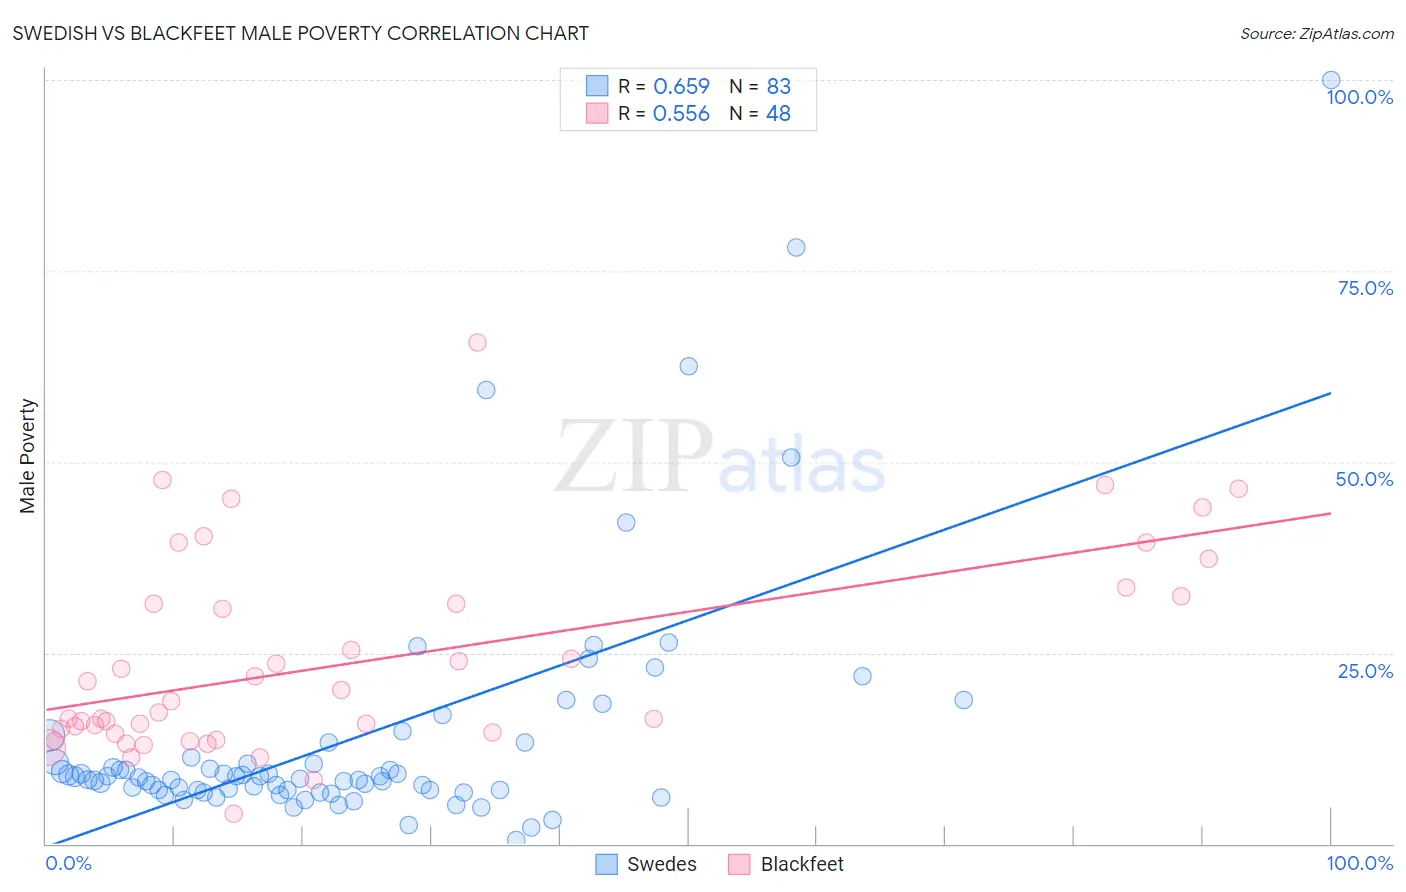
Swedish vs Blackfeet Male Poverty Correlation Chart
The statistical analysis conducted on geographies consisting of 538,008,774 people shows a significant positive correlation between the proportion of Swedes and poverty level among males in the United States with a correlation coefficient (R) of 0.659 and weighted average of 9.6%. Similarly, the statistical analysis conducted on geographies consisting of 309,436,017 people shows a substantial positive correlation between the proportion of Blackfeet and poverty level among males in the United States with a correlation coefficient (R) of 0.556 and weighted average of 14.0%, a difference of 45.4%.
Male Poverty Correlation Summary
| Measurement | Swedish | Blackfeet |
| Minimum | 0.53% | 3.9% |
| Maximum | 100.0% | 65.7% |
| Range | 99.5% | 61.8% |
| Mean | 13.8% | 23.9% |
| Median | 8.6% | 17.9% |
| Interquartile 25% (IQ1) | 7.0% | 14.4% |
| Interquartile 75% (IQ3) | 11.3% | 31.9% |
| Interquartile Range (IQR) | 4.3% | 17.5% |
| Standard Deviation (Sample) | 16.3% | 13.2% |
| Standard Deviation (Population) | 16.2% | 13.0% |
Similar Demographics by Male Poverty
Demographics Similar to Swedes by Male Poverty
In terms of male poverty, the demographic groups most similar to Swedes are Italian (9.6%, a difference of 0.080%), Croatian (9.6%, a difference of 0.090%), Eastern European (9.6%, a difference of 0.14%), Immigrants from Scotland (9.6%, a difference of 0.34%), and Burmese (9.7%, a difference of 0.58%).
| Demographics | Rating | Rank | Male Poverty |
| Norwegians | 99.8 /100 | #17 | Exceptional 9.5% |
| Lithuanians | 99.8 /100 | #18 | Exceptional 9.5% |
| Immigrants | Hong Kong | 99.7 /100 | #19 | Exceptional 9.6% |
| Latvians | 99.7 /100 | #20 | Exceptional 9.6% |
| Immigrants | Scotland | 99.7 /100 | #21 | Exceptional 9.6% |
| Croatians | 99.7 /100 | #22 | Exceptional 9.6% |
| Italians | 99.7 /100 | #23 | Exceptional 9.6% |
| Swedes | 99.7 /100 | #24 | Exceptional 9.6% |
| Eastern Europeans | 99.6 /100 | #25 | Exceptional 9.6% |
| Burmese | 99.6 /100 | #26 | Exceptional 9.7% |
| Danes | 99.6 /100 | #27 | Exceptional 9.7% |
| Immigrants | Korea | 99.6 /100 | #28 | Exceptional 9.7% |
| Greeks | 99.6 /100 | #29 | Exceptional 9.7% |
| Poles | 99.5 /100 | #30 | Exceptional 9.7% |
| Tongans | 99.5 /100 | #31 | Exceptional 9.7% |
Demographics Similar to Blackfeet by Male Poverty
In terms of male poverty, the demographic groups most similar to Blackfeet are Inupiat (14.0%, a difference of 0.030%), Immigrants from Guatemala (14.0%, a difference of 0.10%), Immigrants from Mexico (14.0%, a difference of 0.22%), Immigrants from Senegal (14.0%, a difference of 0.29%), and Immigrants from Caribbean (14.0%, a difference of 0.34%).
| Demographics | Rating | Rank | Male Poverty |
| Vietnamese | 0.0 /100 | #291 | Tragic 13.8% |
| Indonesians | 0.0 /100 | #292 | Tragic 13.8% |
| Immigrants | Belize | 0.0 /100 | #293 | Tragic 13.8% |
| Hispanics or Latinos | 0.0 /100 | #294 | Tragic 13.9% |
| Immigrants | Central America | 0.0 /100 | #295 | Tragic 13.9% |
| Cajuns | 0.0 /100 | #296 | Tragic 13.9% |
| Inupiat | 0.0 /100 | #297 | Tragic 14.0% |
| Blackfeet | 0.0 /100 | #298 | Tragic 14.0% |
| Immigrants | Guatemala | 0.0 /100 | #299 | Tragic 14.0% |
| Immigrants | Mexico | 0.0 /100 | #300 | Tragic 14.0% |
| Immigrants | Senegal | 0.0 /100 | #301 | Tragic 14.0% |
| Immigrants | Caribbean | 0.0 /100 | #302 | Tragic 14.0% |
| Bahamians | 0.0 /100 | #303 | Tragic 14.1% |
| Senegalese | 0.0 /100 | #304 | Tragic 14.1% |
| Immigrants | Bangladesh | 0.0 /100 | #305 | Tragic 14.1% |