Potawatomi vs Bhutanese Child Poverty Under the Age of 5
COMPARE
Potawatomi
Bhutanese
Child Poverty Under the Age of 5
Child Poverty Under the Age of 5 Comparison
Potawatomi
Bhutanese
21.0%
CHILD POVERTY UNDER THE AGE OF 5
0.0/ 100
METRIC RATING
282nd/ 347
METRIC RANK
13.4%
CHILD POVERTY UNDER THE AGE OF 5
100.0/ 100
METRIC RATING
13th/ 347
METRIC RANK
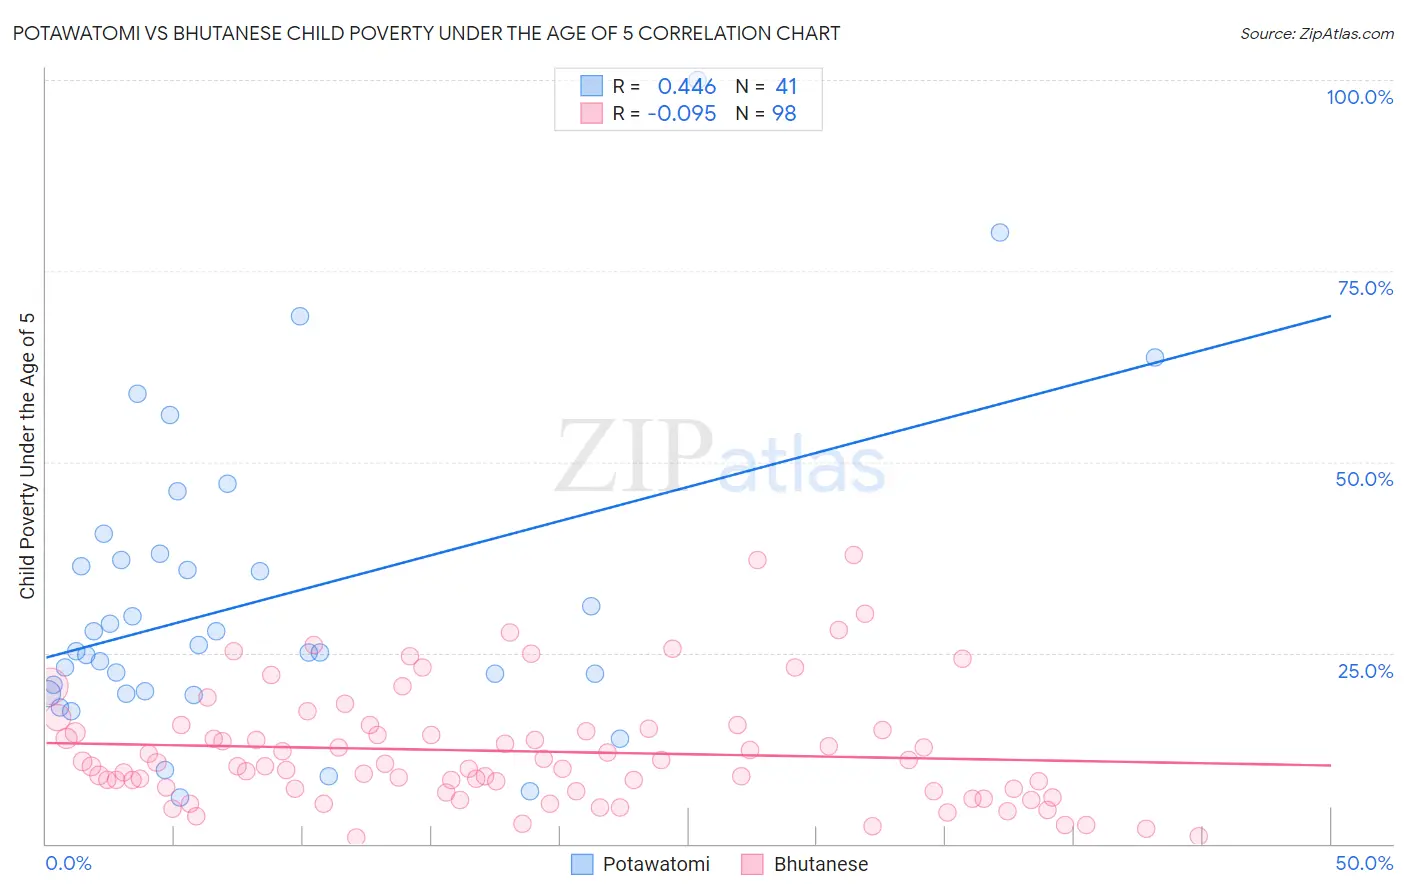
Potawatomi vs Bhutanese Child Poverty Under the Age of 5 Correlation Chart
The statistical analysis conducted on geographies consisting of 116,008,403 people shows a moderate positive correlation between the proportion of Potawatomi and poverty level among children under the age of 5 in the United States with a correlation coefficient (R) of 0.446 and weighted average of 21.0%. Similarly, the statistical analysis conducted on geographies consisting of 434,270,600 people shows a slight negative correlation between the proportion of Bhutanese and poverty level among children under the age of 5 in the United States with a correlation coefficient (R) of -0.095 and weighted average of 13.4%, a difference of 57.3%.
Child Poverty Under the Age of 5 Correlation Summary
| Measurement | Potawatomi | Bhutanese |
| Minimum | 6.1% | 0.77% |
| Maximum | 100.0% | 37.8% |
| Range | 93.9% | 37.1% |
| Mean | 31.9% | 12.1% |
| Median | 25.1% | 10.1% |
| Interquartile 25% (IQ1) | 19.8% | 6.9% |
| Interquartile 75% (IQ3) | 37.6% | 14.8% |
| Interquartile Range (IQR) | 17.8% | 7.9% |
| Standard Deviation (Sample) | 19.8% | 7.7% |
| Standard Deviation (Population) | 19.6% | 7.6% |
Similar Demographics by Child Poverty Under the Age of 5
Demographics Similar to Potawatomi by Child Poverty Under the Age of 5
In terms of child poverty under the age of 5, the demographic groups most similar to Potawatomi are Comanche (21.0%, a difference of 0.20%), Somali (21.1%, a difference of 0.53%), Senegalese (20.9%, a difference of 0.54%), French American Indian (20.8%, a difference of 0.77%), and Haitian (21.2%, a difference of 1.0%).
| Demographics | Rating | Rank | Child Poverty Under the Age of 5 |
| Bangladeshis | 0.1 /100 | #275 | Tragic 20.6% |
| West Indians | 0.0 /100 | #276 | Tragic 20.6% |
| Immigrants | West Indies | 0.0 /100 | #277 | Tragic 20.7% |
| Immigrants | Grenada | 0.0 /100 | #278 | Tragic 20.7% |
| Sub-Saharan Africans | 0.0 /100 | #279 | Tragic 20.8% |
| French American Indians | 0.0 /100 | #280 | Tragic 20.8% |
| Senegalese | 0.0 /100 | #281 | Tragic 20.9% |
| Potawatomi | 0.0 /100 | #282 | Tragic 21.0% |
| Comanche | 0.0 /100 | #283 | Tragic 21.0% |
| Somalis | 0.0 /100 | #284 | Tragic 21.1% |
| Haitians | 0.0 /100 | #285 | Tragic 21.2% |
| Immigrants | Latin America | 0.0 /100 | #286 | Tragic 21.2% |
| Immigrants | Zaire | 0.0 /100 | #287 | Tragic 21.3% |
| Immigrants | Senegal | 0.0 /100 | #288 | Tragic 21.3% |
| Immigrants | Haiti | 0.0 /100 | #289 | Tragic 21.3% |
Demographics Similar to Bhutanese by Child Poverty Under the Age of 5
In terms of child poverty under the age of 5, the demographic groups most similar to Bhutanese are Okinawan (13.4%, a difference of 0.65%), Indian (Asian) (13.4%, a difference of 0.70%), Immigrants from South Central Asia (13.3%, a difference of 0.75%), Immigrants from Korea (13.2%, a difference of 0.86%), and Burmese (13.2%, a difference of 0.96%).
| Demographics | Rating | Rank | Child Poverty Under the Age of 5 |
| Immigrants | Singapore | 100.0 /100 | #6 | Exceptional 12.9% |
| Chinese | 100.0 /100 | #7 | Exceptional 13.1% |
| Iranians | 100.0 /100 | #8 | Exceptional 13.1% |
| Immigrants | Iran | 100.0 /100 | #9 | Exceptional 13.1% |
| Burmese | 100.0 /100 | #10 | Exceptional 13.2% |
| Immigrants | Korea | 100.0 /100 | #11 | Exceptional 13.2% |
| Immigrants | South Central Asia | 100.0 /100 | #12 | Exceptional 13.3% |
| Bhutanese | 100.0 /100 | #13 | Exceptional 13.4% |
| Okinawans | 100.0 /100 | #14 | Exceptional 13.4% |
| Indians (Asian) | 100.0 /100 | #15 | Exceptional 13.4% |
| Immigrants | Eastern Asia | 100.0 /100 | #16 | Exceptional 13.5% |
| Assyrians/Chaldeans/Syriacs | 100.0 /100 | #17 | Exceptional 13.6% |
| Immigrants | China | 100.0 /100 | #18 | Exceptional 13.6% |
| Immigrants | Ireland | 100.0 /100 | #19 | Exceptional 13.7% |
| Immigrants | Japan | 100.0 /100 | #20 | Exceptional 13.8% |