Dominican vs Bhutanese Child Poverty Under the Age of 5
COMPARE
Dominican
Bhutanese
Child Poverty Under the Age of 5
Child Poverty Under the Age of 5 Comparison
Dominicans
Bhutanese
24.0%
CHILD POVERTY UNDER THE AGE OF 5
0.0/ 100
METRIC RATING
327th/ 347
METRIC RANK
13.4%
CHILD POVERTY UNDER THE AGE OF 5
100.0/ 100
METRIC RATING
13th/ 347
METRIC RANK
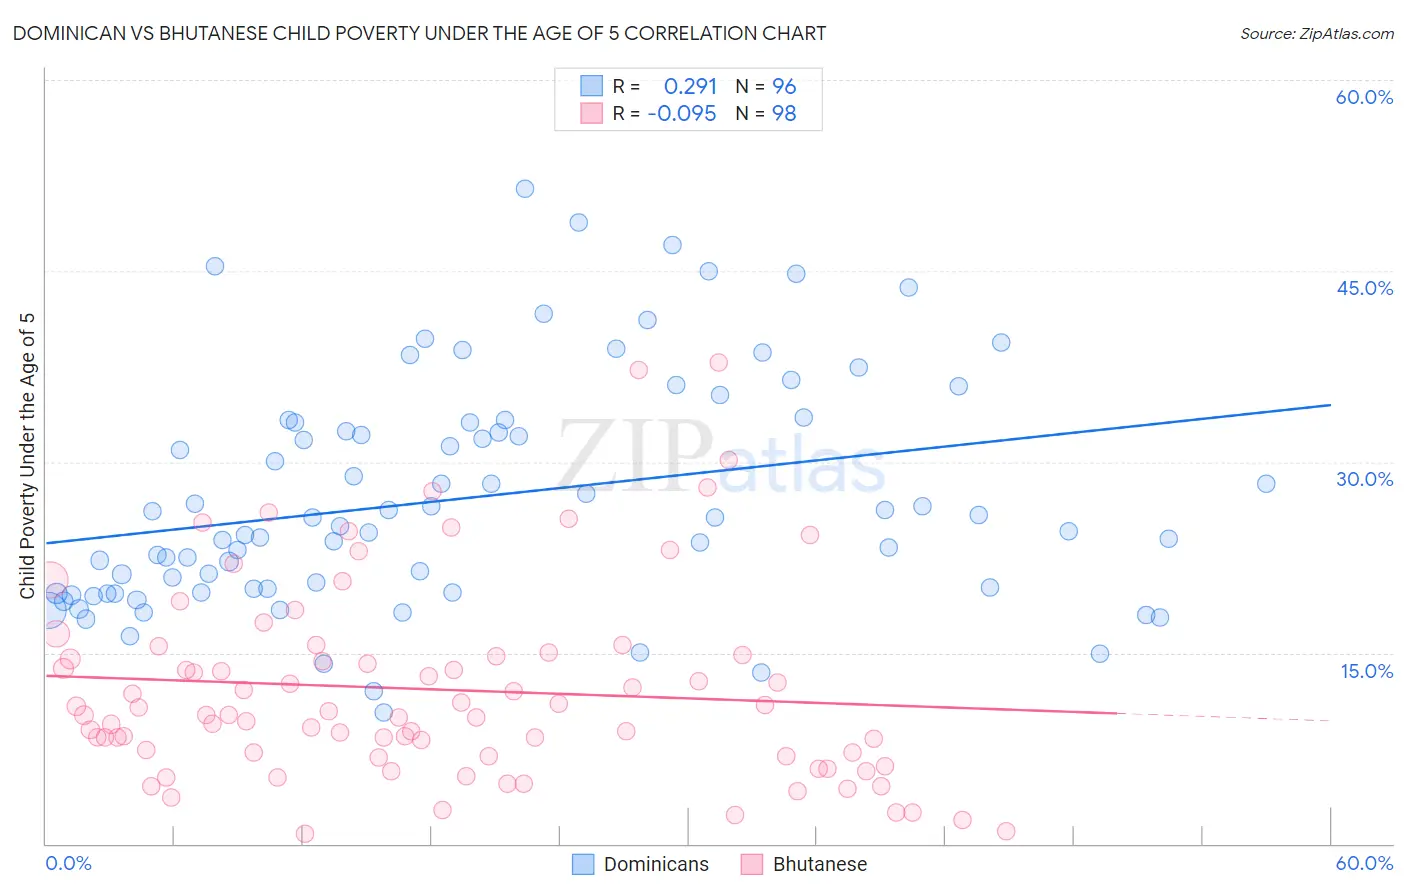
Dominican vs Bhutanese Child Poverty Under the Age of 5 Correlation Chart
The statistical analysis conducted on geographies consisting of 342,515,454 people shows a weak positive correlation between the proportion of Dominicans and poverty level among children under the age of 5 in the United States with a correlation coefficient (R) of 0.291 and weighted average of 24.0%. Similarly, the statistical analysis conducted on geographies consisting of 434,270,600 people shows a slight negative correlation between the proportion of Bhutanese and poverty level among children under the age of 5 in the United States with a correlation coefficient (R) of -0.095 and weighted average of 13.4%, a difference of 79.9%.
Child Poverty Under the Age of 5 Correlation Summary
| Measurement | Dominican | Bhutanese |
| Minimum | 10.3% | 0.77% |
| Maximum | 51.4% | 37.8% |
| Range | 41.1% | 37.1% |
| Mean | 27.2% | 12.1% |
| Median | 25.2% | 10.1% |
| Interquartile 25% (IQ1) | 19.9% | 6.9% |
| Interquartile 75% (IQ3) | 33.1% | 14.8% |
| Interquartile Range (IQR) | 13.2% | 7.9% |
| Standard Deviation (Sample) | 9.0% | 7.7% |
| Standard Deviation (Population) | 9.0% | 7.6% |
Similar Demographics by Child Poverty Under the Age of 5
Demographics Similar to Dominicans by Child Poverty Under the Age of 5
In terms of child poverty under the age of 5, the demographic groups most similar to Dominicans are Immigrants from Dominican Republic (24.1%, a difference of 0.090%), Cajun (24.1%, a difference of 0.32%), Central American Indian (23.9%, a difference of 0.45%), Immigrants from Congo (23.9%, a difference of 0.64%), and Creek (24.2%, a difference of 0.76%).
| Demographics | Rating | Rank | Child Poverty Under the Age of 5 |
| Choctaw | 0.0 /100 | #320 | Tragic 23.5% |
| Immigrants | Honduras | 0.0 /100 | #321 | Tragic 23.5% |
| Ute | 0.0 /100 | #322 | Tragic 23.5% |
| Pueblo | 0.0 /100 | #323 | Tragic 23.7% |
| Paiute | 0.0 /100 | #324 | Tragic 23.8% |
| Immigrants | Congo | 0.0 /100 | #325 | Tragic 23.9% |
| Central American Indians | 0.0 /100 | #326 | Tragic 23.9% |
| Dominicans | 0.0 /100 | #327 | Tragic 24.0% |
| Immigrants | Dominican Republic | 0.0 /100 | #328 | Tragic 24.1% |
| Cajuns | 0.0 /100 | #329 | Tragic 24.1% |
| Creek | 0.0 /100 | #330 | Tragic 24.2% |
| Kiowa | 0.0 /100 | #331 | Tragic 24.5% |
| Apache | 0.0 /100 | #332 | Tragic 25.0% |
| Natives/Alaskans | 0.0 /100 | #333 | Tragic 25.6% |
| Blacks/African Americans | 0.0 /100 | #334 | Tragic 25.7% |
Demographics Similar to Bhutanese by Child Poverty Under the Age of 5
In terms of child poverty under the age of 5, the demographic groups most similar to Bhutanese are Okinawan (13.4%, a difference of 0.65%), Indian (Asian) (13.4%, a difference of 0.70%), Immigrants from South Central Asia (13.3%, a difference of 0.75%), Immigrants from Korea (13.2%, a difference of 0.86%), and Burmese (13.2%, a difference of 0.96%).
| Demographics | Rating | Rank | Child Poverty Under the Age of 5 |
| Immigrants | Singapore | 100.0 /100 | #6 | Exceptional 12.9% |
| Chinese | 100.0 /100 | #7 | Exceptional 13.1% |
| Iranians | 100.0 /100 | #8 | Exceptional 13.1% |
| Immigrants | Iran | 100.0 /100 | #9 | Exceptional 13.1% |
| Burmese | 100.0 /100 | #10 | Exceptional 13.2% |
| Immigrants | Korea | 100.0 /100 | #11 | Exceptional 13.2% |
| Immigrants | South Central Asia | 100.0 /100 | #12 | Exceptional 13.3% |
| Bhutanese | 100.0 /100 | #13 | Exceptional 13.4% |
| Okinawans | 100.0 /100 | #14 | Exceptional 13.4% |
| Indians (Asian) | 100.0 /100 | #15 | Exceptional 13.4% |
| Immigrants | Eastern Asia | 100.0 /100 | #16 | Exceptional 13.5% |
| Assyrians/Chaldeans/Syriacs | 100.0 /100 | #17 | Exceptional 13.6% |
| Immigrants | China | 100.0 /100 | #18 | Exceptional 13.6% |
| Immigrants | Ireland | 100.0 /100 | #19 | Exceptional 13.7% |
| Immigrants | Japan | 100.0 /100 | #20 | Exceptional 13.8% |