Immigrants from Africa vs Immigrants from Netherlands Poverty
COMPARE
Immigrants from Africa
Immigrants from Netherlands
Poverty
Poverty Comparison
Immigrants from Africa
Immigrants from Netherlands
13.4%
POVERTY
2.5/ 100
METRIC RATING
223rd/ 347
METRIC RANK
11.2%
POVERTY
97.5/ 100
METRIC RATING
66th/ 347
METRIC RANK
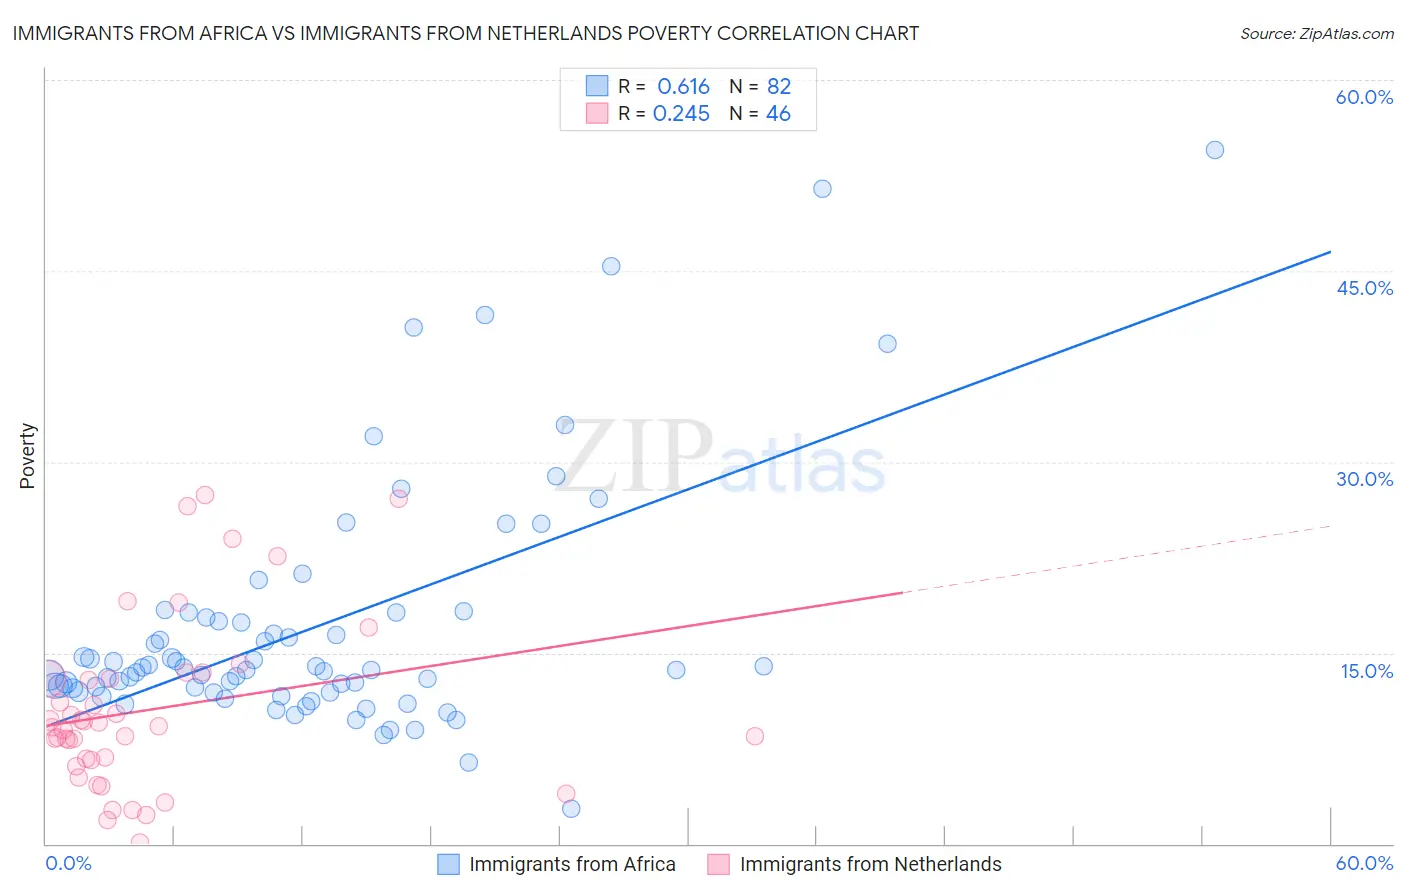
Immigrants from Africa vs Immigrants from Netherlands Poverty Correlation Chart
The statistical analysis conducted on geographies consisting of 468,948,524 people shows a significant positive correlation between the proportion of Immigrants from Africa and poverty level in the United States with a correlation coefficient (R) of 0.616 and weighted average of 13.4%. Similarly, the statistical analysis conducted on geographies consisting of 237,819,327 people shows a weak positive correlation between the proportion of Immigrants from Netherlands and poverty level in the United States with a correlation coefficient (R) of 0.245 and weighted average of 11.2%, a difference of 19.4%.
Poverty Correlation Summary
| Measurement | Immigrants from Africa | Immigrants from Netherlands |
| Minimum | 2.7% | 0.13% |
| Maximum | 54.5% | 27.4% |
| Range | 51.8% | 27.2% |
| Mean | 17.1% | 10.6% |
| Median | 13.7% | 9.2% |
| Interquartile 25% (IQ1) | 12.0% | 6.6% |
| Interquartile 75% (IQ3) | 17.8% | 13.0% |
| Interquartile Range (IQR) | 5.8% | 6.4% |
| Standard Deviation (Sample) | 9.7% | 6.8% |
| Standard Deviation (Population) | 9.7% | 6.7% |
Similar Demographics by Poverty
Demographics Similar to Immigrants from Africa by Poverty
In terms of poverty, the demographic groups most similar to Immigrants from Africa are Immigrants from Micronesia (13.4%, a difference of 0.040%), Alsatian (13.4%, a difference of 0.080%), Immigrants from Eritrea (13.4%, a difference of 0.10%), American (13.4%, a difference of 0.28%), and German Russian (13.4%, a difference of 0.31%).
| Demographics | Rating | Rank | Poverty |
| Immigrants | Nonimmigrants | 3.3 /100 | #216 | Tragic 13.3% |
| Immigrants | Uzbekistan | 3.2 /100 | #217 | Tragic 13.3% |
| Immigrants | Thailand | 3.1 /100 | #218 | Tragic 13.3% |
| Immigrants | Cambodia | 3.0 /100 | #219 | Tragic 13.4% |
| Americans | 2.9 /100 | #220 | Tragic 13.4% |
| Alsatians | 2.6 /100 | #221 | Tragic 13.4% |
| Immigrants | Micronesia | 2.6 /100 | #222 | Tragic 13.4% |
| Immigrants | Africa | 2.5 /100 | #223 | Tragic 13.4% |
| Immigrants | Eritrea | 2.4 /100 | #224 | Tragic 13.4% |
| German Russians | 2.2 /100 | #225 | Tragic 13.4% |
| Marshallese | 2.2 /100 | #226 | Tragic 13.4% |
| Alaska Natives | 2.1 /100 | #227 | Tragic 13.5% |
| Immigrants | Nigeria | 1.7 /100 | #228 | Tragic 13.5% |
| Osage | 1.5 /100 | #229 | Tragic 13.6% |
| Alaskan Athabascans | 1.5 /100 | #230 | Tragic 13.6% |
Demographics Similar to Immigrants from Netherlands by Poverty
In terms of poverty, the demographic groups most similar to Immigrants from Netherlands are Immigrants from Australia (11.2%, a difference of 0.040%), Slovak (11.2%, a difference of 0.060%), Immigrants from Asia (11.2%, a difference of 0.070%), Serbian (11.2%, a difference of 0.12%), and Swiss (11.2%, a difference of 0.20%).
| Demographics | Rating | Rank | Poverty |
| Immigrants | Europe | 98.0 /100 | #59 | Exceptional 11.2% |
| Immigrants | Sri Lanka | 97.9 /100 | #60 | Exceptional 11.2% |
| Immigrants | Italy | 97.9 /100 | #61 | Exceptional 11.2% |
| Austrians | 97.8 /100 | #62 | Exceptional 11.2% |
| Ukrainians | 97.8 /100 | #63 | Exceptional 11.2% |
| Swiss | 97.7 /100 | #64 | Exceptional 11.2% |
| Immigrants | Asia | 97.5 /100 | #65 | Exceptional 11.2% |
| Immigrants | Netherlands | 97.5 /100 | #66 | Exceptional 11.2% |
| Immigrants | Australia | 97.4 /100 | #67 | Exceptional 11.2% |
| Slovaks | 97.4 /100 | #68 | Exceptional 11.2% |
| Serbians | 97.4 /100 | #69 | Exceptional 11.2% |
| Immigrants | Canada | 97.3 /100 | #70 | Exceptional 11.3% |
| Zimbabweans | 97.3 /100 | #71 | Exceptional 11.3% |
| Europeans | 97.2 /100 | #72 | Exceptional 11.3% |
| Immigrants | Belgium | 97.2 /100 | #73 | Exceptional 11.3% |