Immigrants from Israel vs Immigrants from Netherlands Poverty
COMPARE
Immigrants from Israel
Immigrants from Netherlands
Poverty
Poverty Comparison
Immigrants from Israel
Immigrants from Netherlands
11.7%
POVERTY
87.4/ 100
METRIC RATING
128th/ 347
METRIC RANK
11.2%
POVERTY
97.5/ 100
METRIC RATING
66th/ 347
METRIC RANK
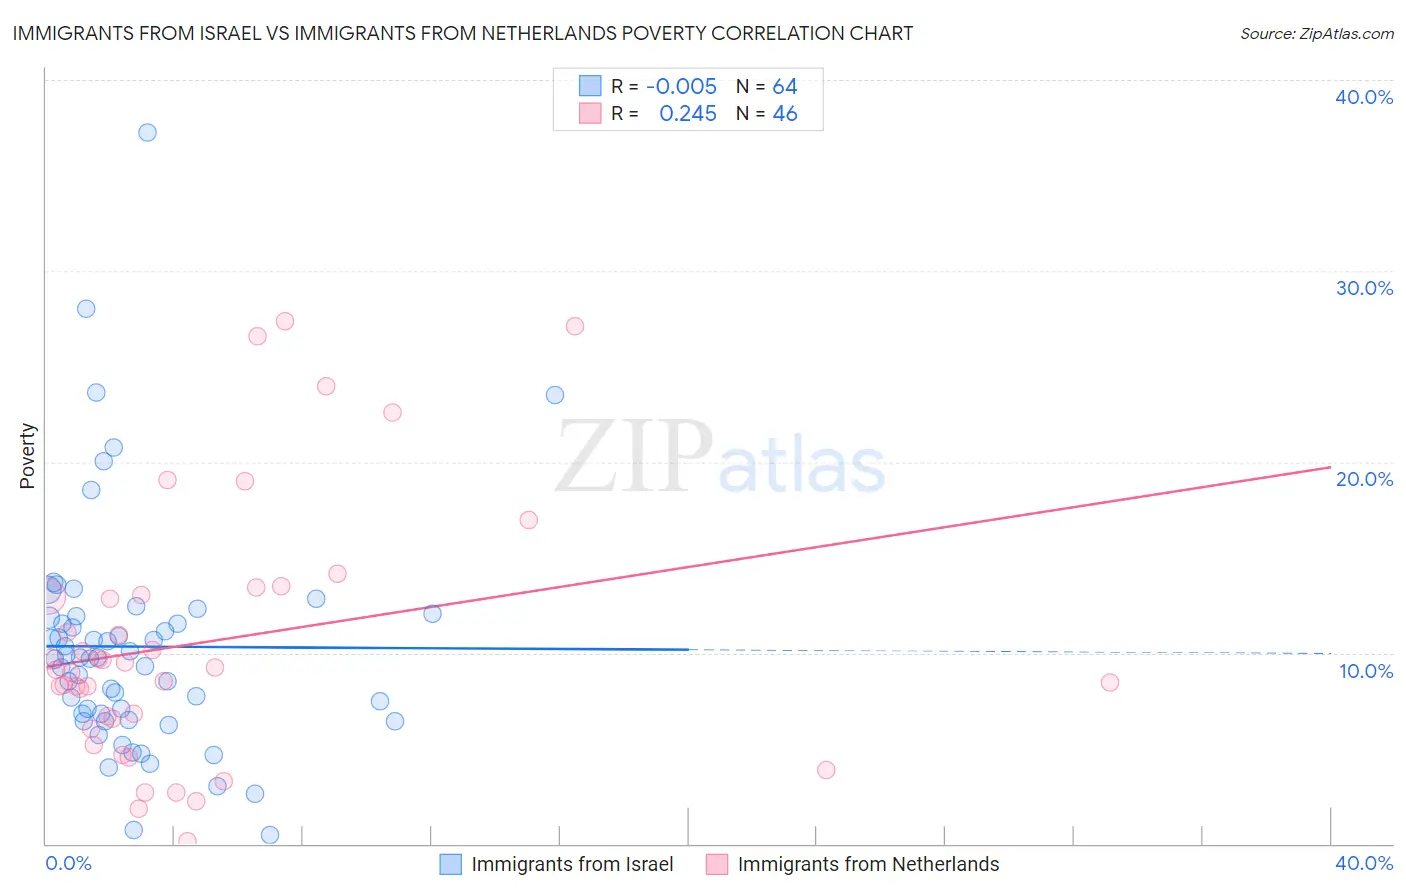
Immigrants from Israel vs Immigrants from Netherlands Poverty Correlation Chart
The statistical analysis conducted on geographies consisting of 209,974,563 people shows no correlation between the proportion of Immigrants from Israel and poverty level in the United States with a correlation coefficient (R) of -0.005 and weighted average of 11.7%. Similarly, the statistical analysis conducted on geographies consisting of 237,819,327 people shows a weak positive correlation between the proportion of Immigrants from Netherlands and poverty level in the United States with a correlation coefficient (R) of 0.245 and weighted average of 11.2%, a difference of 4.6%.
Poverty Correlation Summary
| Measurement | Immigrants from Israel | Immigrants from Netherlands |
| Minimum | 0.47% | 0.13% |
| Maximum | 37.3% | 27.4% |
| Range | 36.8% | 27.2% |
| Mean | 10.3% | 10.6% |
| Median | 9.7% | 9.2% |
| Interquartile 25% (IQ1) | 6.6% | 6.6% |
| Interquartile 75% (IQ3) | 11.9% | 13.0% |
| Interquartile Range (IQR) | 5.2% | 6.4% |
| Standard Deviation (Sample) | 6.2% | 6.8% |
| Standard Deviation (Population) | 6.1% | 6.7% |
Similar Demographics by Poverty
Demographics Similar to Immigrants from Israel by Poverty
In terms of poverty, the demographic groups most similar to Immigrants from Israel are South African (11.7%, a difference of 0.090%), Immigrants from Argentina (11.7%, a difference of 0.13%), Immigrants from Norway (11.7%, a difference of 0.14%), Immigrants from Brazil (11.7%, a difference of 0.18%), and Immigrants from Ukraine (11.8%, a difference of 0.19%).
| Demographics | Rating | Rank | Poverty |
| New Zealanders | 88.7 /100 | #121 | Excellent 11.7% |
| Puget Sound Salish | 88.7 /100 | #122 | Excellent 11.7% |
| Immigrants | Hungary | 88.6 /100 | #123 | Excellent 11.7% |
| Soviet Union | 88.4 /100 | #124 | Excellent 11.7% |
| Immigrants | Brazil | 88.2 /100 | #125 | Excellent 11.7% |
| Immigrants | Norway | 88.0 /100 | #126 | Excellent 11.7% |
| Immigrants | Argentina | 88.0 /100 | #127 | Excellent 11.7% |
| Immigrants | Israel | 87.4 /100 | #128 | Excellent 11.7% |
| South Africans | 87.0 /100 | #129 | Excellent 11.7% |
| Immigrants | Ukraine | 86.6 /100 | #130 | Excellent 11.8% |
| French | 86.1 /100 | #131 | Excellent 11.8% |
| Peruvians | 85.6 /100 | #132 | Excellent 11.8% |
| Immigrants | Western Europe | 85.2 /100 | #133 | Excellent 11.8% |
| Yugoslavians | 85.2 /100 | #134 | Excellent 11.8% |
| Immigrants | Vietnam | 85.2 /100 | #135 | Excellent 11.8% |
Demographics Similar to Immigrants from Netherlands by Poverty
In terms of poverty, the demographic groups most similar to Immigrants from Netherlands are Immigrants from Australia (11.2%, a difference of 0.040%), Slovak (11.2%, a difference of 0.060%), Immigrants from Asia (11.2%, a difference of 0.070%), Serbian (11.2%, a difference of 0.12%), and Swiss (11.2%, a difference of 0.20%).
| Demographics | Rating | Rank | Poverty |
| Immigrants | Europe | 98.0 /100 | #59 | Exceptional 11.2% |
| Immigrants | Sri Lanka | 97.9 /100 | #60 | Exceptional 11.2% |
| Immigrants | Italy | 97.9 /100 | #61 | Exceptional 11.2% |
| Austrians | 97.8 /100 | #62 | Exceptional 11.2% |
| Ukrainians | 97.8 /100 | #63 | Exceptional 11.2% |
| Swiss | 97.7 /100 | #64 | Exceptional 11.2% |
| Immigrants | Asia | 97.5 /100 | #65 | Exceptional 11.2% |
| Immigrants | Netherlands | 97.5 /100 | #66 | Exceptional 11.2% |
| Immigrants | Australia | 97.4 /100 | #67 | Exceptional 11.2% |
| Slovaks | 97.4 /100 | #68 | Exceptional 11.2% |
| Serbians | 97.4 /100 | #69 | Exceptional 11.2% |
| Immigrants | Canada | 97.3 /100 | #70 | Exceptional 11.3% |
| Zimbabweans | 97.3 /100 | #71 | Exceptional 11.3% |
| Europeans | 97.2 /100 | #72 | Exceptional 11.3% |
| Immigrants | Belgium | 97.2 /100 | #73 | Exceptional 11.3% |