Polish vs Immigrants from Belize Female Poverty Among 18-24 Year Olds
COMPARE
Polish
Immigrants from Belize
Female Poverty Among 18-24 Year Olds
Female Poverty Among 18-24 Year Olds Comparison
Poles
Immigrants from Belize
18.8%
FEMALE POVERTY AMONG 18-24 YEAR OLDS
99.6/ 100
METRIC RATING
75th/ 347
METRIC RANK
19.8%
FEMALE POVERTY AMONG 18-24 YEAR OLDS
74.1/ 100
METRIC RATING
161st/ 347
METRIC RANK
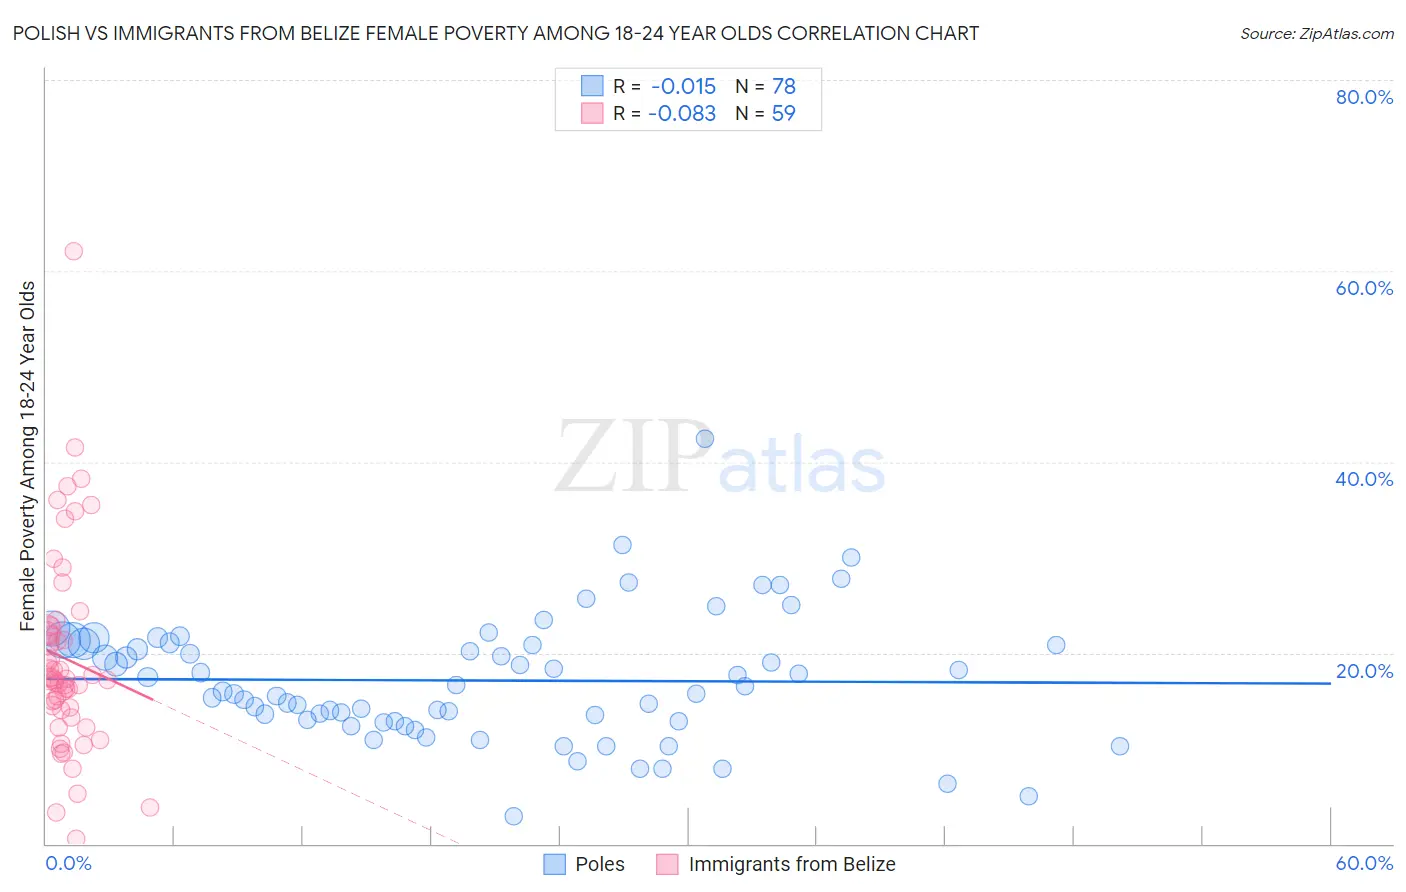
Polish vs Immigrants from Belize Female Poverty Among 18-24 Year Olds Correlation Chart
The statistical analysis conducted on geographies consisting of 527,608,835 people shows no correlation between the proportion of Poles and poverty level among females between the ages 18 and 24 in the United States with a correlation coefficient (R) of -0.015 and weighted average of 18.8%. Similarly, the statistical analysis conducted on geographies consisting of 129,541,689 people shows a slight negative correlation between the proportion of Immigrants from Belize and poverty level among females between the ages 18 and 24 in the United States with a correlation coefficient (R) of -0.083 and weighted average of 19.8%, a difference of 5.7%.
Female Poverty Among 18-24 Year Olds Correlation Summary
| Measurement | Polish | Immigrants from Belize |
| Minimum | 2.8% | 0.55% |
| Maximum | 42.4% | 62.1% |
| Range | 39.6% | 61.5% |
| Mean | 17.1% | 19.4% |
| Median | 16.3% | 17.2% |
| Interquartile 25% (IQ1) | 12.8% | 14.0% |
| Interquartile 75% (IQ3) | 21.0% | 22.4% |
| Interquartile Range (IQR) | 8.1% | 8.5% |
| Standard Deviation (Sample) | 6.5% | 10.5% |
| Standard Deviation (Population) | 6.5% | 10.4% |
Similar Demographics by Female Poverty Among 18-24 Year Olds
Demographics Similar to Poles by Female Poverty Among 18-24 Year Olds
In terms of female poverty among 18-24 year olds, the demographic groups most similar to Poles are Immigrants from Cambodia (18.8%, a difference of 0.080%), Costa Rican (18.8%, a difference of 0.18%), Immigrants from Europe (18.8%, a difference of 0.19%), Uruguayan (18.8%, a difference of 0.19%), and Hawaiian (18.7%, a difference of 0.21%).
| Demographics | Rating | Rank | Female Poverty Among 18-24 Year Olds |
| Brazilians | 99.8 /100 | #68 | Exceptional 18.6% |
| Immigrants | Bulgaria | 99.7 /100 | #69 | Exceptional 18.6% |
| Immigrants | Costa Rica | 99.7 /100 | #70 | Exceptional 18.7% |
| Immigrants | Haiti | 99.7 /100 | #71 | Exceptional 18.7% |
| Armenians | 99.7 /100 | #72 | Exceptional 18.7% |
| Lithuanians | 99.7 /100 | #73 | Exceptional 18.7% |
| Hawaiians | 99.6 /100 | #74 | Exceptional 18.7% |
| Poles | 99.6 /100 | #75 | Exceptional 18.8% |
| Immigrants | Cambodia | 99.5 /100 | #76 | Exceptional 18.8% |
| Costa Ricans | 99.5 /100 | #77 | Exceptional 18.8% |
| Immigrants | Europe | 99.5 /100 | #78 | Exceptional 18.8% |
| Uruguayans | 99.5 /100 | #79 | Exceptional 18.8% |
| Palestinians | 99.5 /100 | #80 | Exceptional 18.8% |
| Japanese | 99.5 /100 | #81 | Exceptional 18.8% |
| Immigrants | Uruguay | 99.4 /100 | #82 | Exceptional 18.8% |
Demographics Similar to Immigrants from Belize by Female Poverty Among 18-24 Year Olds
In terms of female poverty among 18-24 year olds, the demographic groups most similar to Immigrants from Belize are Pakistani (19.8%, a difference of 0.0%), Trinidadian and Tobagonian (19.8%, a difference of 0.020%), French Canadian (19.9%, a difference of 0.070%), Immigrants from Lebanon (19.8%, a difference of 0.080%), and Danish (19.8%, a difference of 0.090%).
| Demographics | Rating | Rank | Female Poverty Among 18-24 Year Olds |
| Immigrants | Zimbabwe | 76.7 /100 | #154 | Good 19.8% |
| Hungarians | 76.6 /100 | #155 | Good 19.8% |
| Immigrants | Belgium | 76.4 /100 | #156 | Good 19.8% |
| Danes | 75.5 /100 | #157 | Good 19.8% |
| Immigrants | Lebanon | 75.3 /100 | #158 | Good 19.8% |
| Trinidadians and Tobagonians | 74.4 /100 | #159 | Good 19.8% |
| Pakistanis | 74.1 /100 | #160 | Good 19.8% |
| Immigrants | Belize | 74.1 /100 | #161 | Good 19.8% |
| French Canadians | 73.0 /100 | #162 | Good 19.9% |
| Malaysians | 72.7 /100 | #163 | Good 19.9% |
| Central Americans | 70.0 /100 | #164 | Good 19.9% |
| Eastern Europeans | 69.3 /100 | #165 | Good 19.9% |
| Belgians | 69.1 /100 | #166 | Good 19.9% |
| Czechoslovakians | 61.8 /100 | #167 | Good 20.0% |
| Fijians | 59.1 /100 | #168 | Average 20.0% |