Polish vs Immigrants from Belize College, 1 year or more
COMPARE
Polish
Immigrants from Belize
College, 1 year or more
College, 1 year or more Comparison
Poles
Immigrants from Belize
60.7%
COLLEGE, 1 YEAR OR MORE
82.8/ 100
METRIC RATING
142nd/ 347
METRIC RANK
53.5%
COLLEGE, 1 YEAR OR MORE
0.1/ 100
METRIC RATING
287th/ 347
METRIC RANK
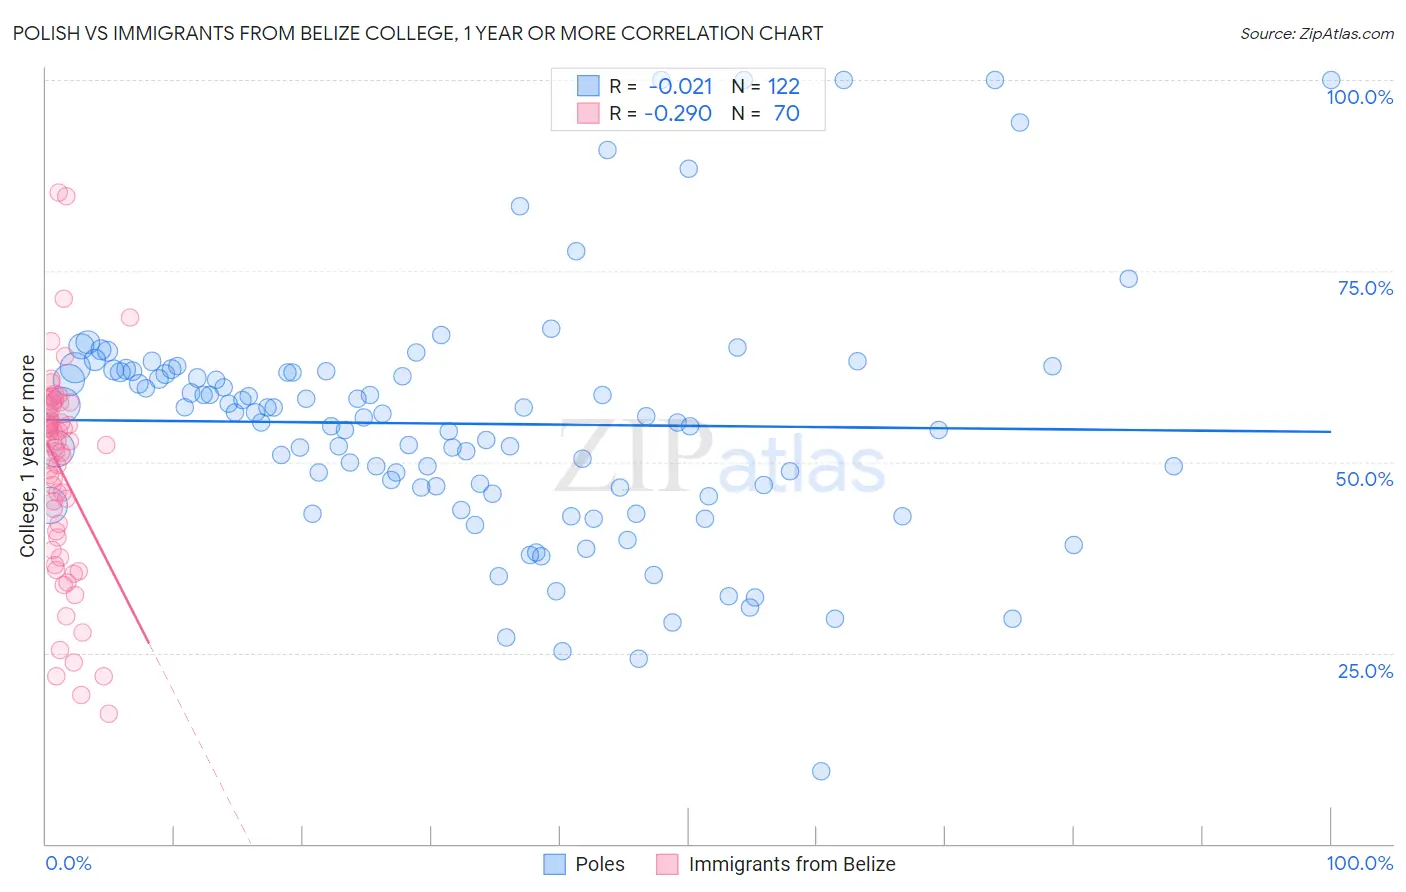
Polish vs Immigrants from Belize College, 1 year or more Correlation Chart
The statistical analysis conducted on geographies consisting of 560,585,948 people shows no correlation between the proportion of Poles and percentage of population with at least college, 1 year or more education in the United States with a correlation coefficient (R) of -0.021 and weighted average of 60.7%. Similarly, the statistical analysis conducted on geographies consisting of 130,329,081 people shows a weak negative correlation between the proportion of Immigrants from Belize and percentage of population with at least college, 1 year or more education in the United States with a correlation coefficient (R) of -0.290 and weighted average of 53.5%, a difference of 13.4%.
College, 1 year or more Correlation Summary
| Measurement | Polish | Immigrants from Belize |
| Minimum | 9.5% | 17.1% |
| Maximum | 100.0% | 85.3% |
| Range | 90.5% | 68.2% |
| Mean | 55.0% | 48.8% |
| Median | 55.9% | 52.1% |
| Interquartile 25% (IQ1) | 46.6% | 40.1% |
| Interquartile 75% (IQ3) | 61.7% | 57.4% |
| Interquartile Range (IQR) | 15.1% | 17.2% |
| Standard Deviation (Sample) | 16.1% | 13.7% |
| Standard Deviation (Population) | 16.0% | 13.6% |
Similar Demographics by College, 1 year or more
Demographics Similar to Poles by College, 1 year or more
In terms of college, 1 year or more, the demographic groups most similar to Poles are Canadian (60.6%, a difference of 0.010%), Immigrants from Afghanistan (60.7%, a difference of 0.030%), Iraqi (60.7%, a difference of 0.050%), Czech (60.6%, a difference of 0.080%), and Immigrants from Eritrea (60.7%, a difference of 0.14%).
| Demographics | Rating | Rank | College, 1 year or more |
| Immigrants | Uganda | 87.4 /100 | #135 | Excellent 60.9% |
| Basques | 87.2 /100 | #136 | Excellent 60.9% |
| Slovenes | 86.5 /100 | #137 | Excellent 60.9% |
| Taiwanese | 84.3 /100 | #138 | Excellent 60.7% |
| Immigrants | Eritrea | 84.3 /100 | #139 | Excellent 60.7% |
| Iraqis | 83.3 /100 | #140 | Excellent 60.7% |
| Immigrants | Afghanistan | 83.1 /100 | #141 | Excellent 60.7% |
| Poles | 82.8 /100 | #142 | Excellent 60.7% |
| Canadians | 82.7 /100 | #143 | Excellent 60.6% |
| Czechs | 81.9 /100 | #144 | Excellent 60.6% |
| Slavs | 81.1 /100 | #145 | Excellent 60.6% |
| Scottish | 80.2 /100 | #146 | Excellent 60.5% |
| Immigrants | Kenya | 79.1 /100 | #147 | Good 60.5% |
| Kenyans | 79.0 /100 | #148 | Good 60.5% |
| Brazilians | 79.0 /100 | #149 | Good 60.5% |
Demographics Similar to Immigrants from Belize by College, 1 year or more
In terms of college, 1 year or more, the demographic groups most similar to Immigrants from Belize are Central American Indian (53.5%, a difference of 0.030%), Immigrants from Guyana (53.5%, a difference of 0.080%), Alaska Native (53.4%, a difference of 0.17%), Immigrants from Ecuador (53.4%, a difference of 0.17%), and Alaskan Athabascan (53.4%, a difference of 0.19%).
| Demographics | Rating | Rank | College, 1 year or more |
| Cheyenne | 0.1 /100 | #280 | Tragic 54.1% |
| Colville | 0.1 /100 | #281 | Tragic 54.1% |
| Guyanese | 0.1 /100 | #282 | Tragic 54.1% |
| Nicaraguans | 0.1 /100 | #283 | Tragic 53.9% |
| Ute | 0.1 /100 | #284 | Tragic 53.8% |
| Immigrants | Guyana | 0.1 /100 | #285 | Tragic 53.5% |
| Central American Indians | 0.1 /100 | #286 | Tragic 53.5% |
| Immigrants | Belize | 0.1 /100 | #287 | Tragic 53.5% |
| Alaska Natives | 0.0 /100 | #288 | Tragic 53.4% |
| Immigrants | Ecuador | 0.0 /100 | #289 | Tragic 53.4% |
| Alaskan Athabascans | 0.0 /100 | #290 | Tragic 53.4% |
| Cubans | 0.0 /100 | #291 | Tragic 53.4% |
| Chickasaw | 0.0 /100 | #292 | Tragic 53.3% |
| Blacks/African Americans | 0.0 /100 | #293 | Tragic 53.3% |
| Cherokee | 0.0 /100 | #294 | Tragic 53.2% |