Polish vs Hispanic or Latino Single Father Poverty
COMPARE
Polish
Hispanic or Latino
Single Father Poverty
Single Father Poverty Comparison
Poles
Hispanics or Latinos
17.3%
SINGLE FATHER POVERTY
0.3/ 100
METRIC RATING
265th/ 347
METRIC RANK
16.8%
SINGLE FATHER POVERTY
6.1/ 100
METRIC RATING
226th/ 347
METRIC RANK
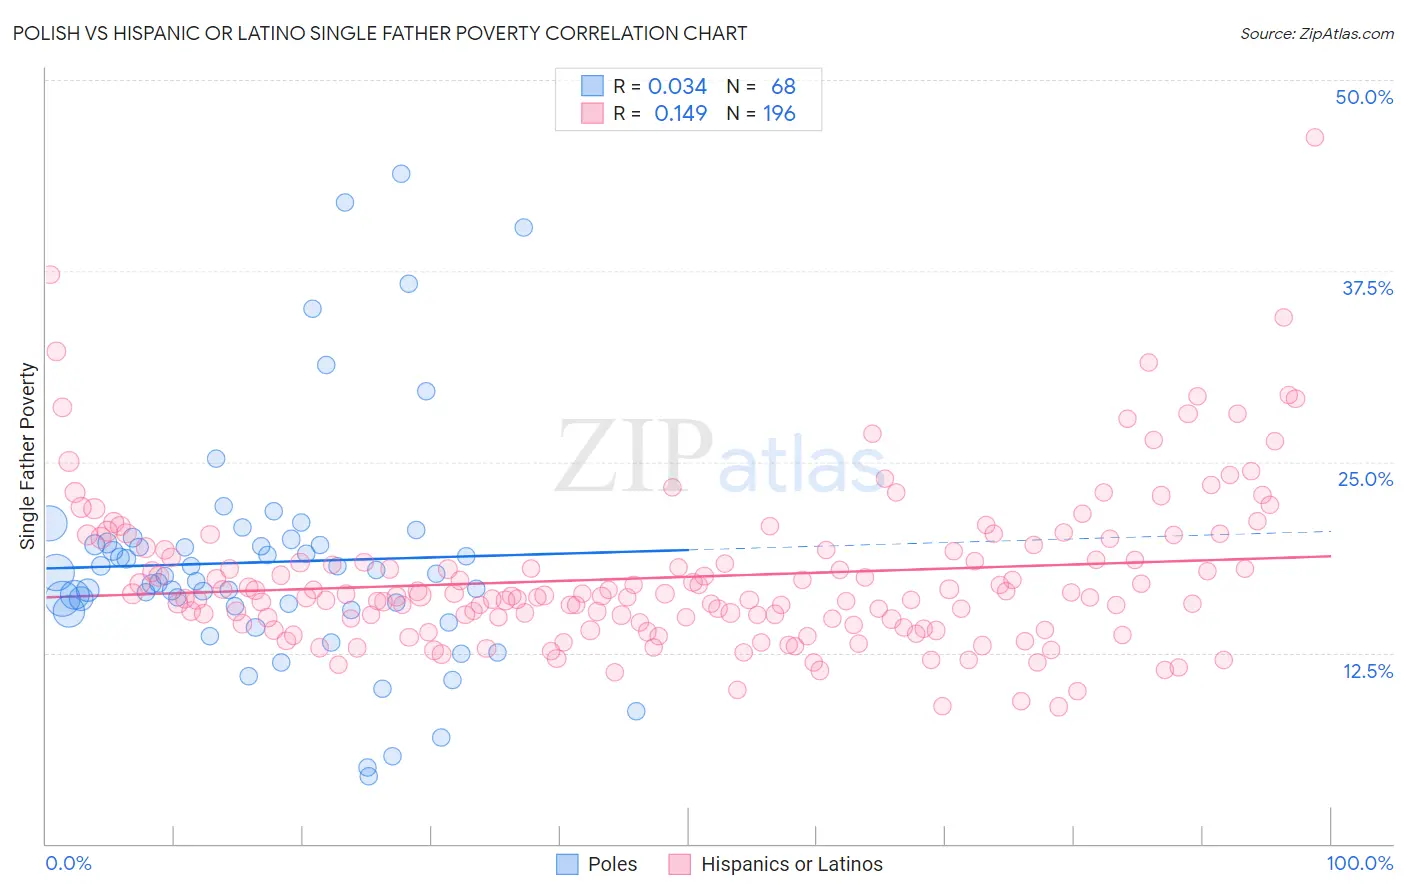
Polish vs Hispanic or Latino Single Father Poverty Correlation Chart
The statistical analysis conducted on geographies consisting of 402,702,262 people shows no correlation between the proportion of Poles and poverty level among single fathers in the United States with a correlation coefficient (R) of 0.034 and weighted average of 17.3%. Similarly, the statistical analysis conducted on geographies consisting of 409,583,815 people shows a poor positive correlation between the proportion of Hispanics or Latinos and poverty level among single fathers in the United States with a correlation coefficient (R) of 0.149 and weighted average of 16.8%, a difference of 3.2%.
Single Father Poverty Correlation Summary
| Measurement | Polish | Hispanic or Latino |
| Minimum | 4.5% | 9.0% |
| Maximum | 43.8% | 46.2% |
| Range | 39.4% | 37.3% |
| Mean | 18.4% | 17.4% |
| Median | 17.6% | 16.2% |
| Interquartile 25% (IQ1) | 15.4% | 14.4% |
| Interquartile 75% (IQ3) | 19.6% | 19.2% |
| Interquartile Range (IQR) | 4.2% | 4.7% |
| Standard Deviation (Sample) | 7.7% | 5.1% |
| Standard Deviation (Population) | 7.6% | 5.1% |
Similar Demographics by Single Father Poverty
Demographics Similar to Poles by Single Father Poverty
In terms of single father poverty, the demographic groups most similar to Poles are Slovene (17.3%, a difference of 0.0%), Jamaican (17.3%, a difference of 0.060%), Haitian (17.3%, a difference of 0.090%), Immigrants from Caribbean (17.4%, a difference of 0.19%), and Lithuanian (17.3%, a difference of 0.21%).
| Demographics | Rating | Rank | Single Father Poverty |
| Albanians | 0.7 /100 | #258 | Tragic 17.2% |
| Immigrants | Jamaica | 0.7 /100 | #259 | Tragic 17.2% |
| Spaniards | 0.6 /100 | #260 | Tragic 17.2% |
| Swiss | 0.5 /100 | #261 | Tragic 17.3% |
| Immigrants | Zaire | 0.4 /100 | #262 | Tragic 17.3% |
| Lithuanians | 0.4 /100 | #263 | Tragic 17.3% |
| Slovenes | 0.3 /100 | #264 | Tragic 17.3% |
| Poles | 0.3 /100 | #265 | Tragic 17.3% |
| Jamaicans | 0.3 /100 | #266 | Tragic 17.3% |
| Haitians | 0.3 /100 | #267 | Tragic 17.3% |
| Immigrants | Caribbean | 0.3 /100 | #268 | Tragic 17.4% |
| Slavs | 0.3 /100 | #269 | Tragic 17.4% |
| Indonesians | 0.2 /100 | #270 | Tragic 17.4% |
| French American Indians | 0.2 /100 | #271 | Tragic 17.4% |
| Barbadians | 0.1 /100 | #272 | Tragic 17.5% |
Demographics Similar to Hispanics or Latinos by Single Father Poverty
In terms of single father poverty, the demographic groups most similar to Hispanics or Latinos are Menominee (16.8%, a difference of 0.050%), Immigrants from Norway (16.8%, a difference of 0.070%), British (16.8%, a difference of 0.10%), Immigrants from Austria (16.8%, a difference of 0.15%), and Belgian (16.8%, a difference of 0.16%).
| Demographics | Rating | Rank | Single Father Poverty |
| Immigrants | Ghana | 8.1 /100 | #219 | Tragic 16.7% |
| Immigrants | Denmark | 8.1 /100 | #220 | Tragic 16.7% |
| Immigrants | Greece | 8.1 /100 | #221 | Tragic 16.7% |
| Immigrants | Spain | 8.0 /100 | #222 | Tragic 16.7% |
| Immigrants | Austria | 7.0 /100 | #223 | Tragic 16.8% |
| Immigrants | Norway | 6.5 /100 | #224 | Tragic 16.8% |
| Menominee | 6.4 /100 | #225 | Tragic 16.8% |
| Hispanics or Latinos | 6.1 /100 | #226 | Tragic 16.8% |
| British | 5.6 /100 | #227 | Tragic 16.8% |
| Belgians | 5.3 /100 | #228 | Tragic 16.8% |
| Israelis | 4.6 /100 | #229 | Tragic 16.8% |
| Immigrants | Trinidad and Tobago | 4.5 /100 | #230 | Tragic 16.8% |
| Spanish Americans | 3.7 /100 | #231 | Tragic 16.9% |
| Immigrants | Grenada | 3.7 /100 | #232 | Tragic 16.9% |
| Senegalese | 3.2 /100 | #233 | Tragic 16.9% |