American vs Apache Seniors Poverty Over the Age of 75
COMPARE
American
Apache
Seniors Poverty Over the Age of 75
Seniors Poverty Over the Age of 75 Comparison
Americans
Apache
12.0%
SENIORS POVERTY OVER THE AGE OF 75
71.0/ 100
METRIC RATING
143rd/ 347
METRIC RANK
15.3%
SENIORS POVERTY OVER THE AGE OF 75
0.0/ 100
METRIC RATING
293rd/ 347
METRIC RANK
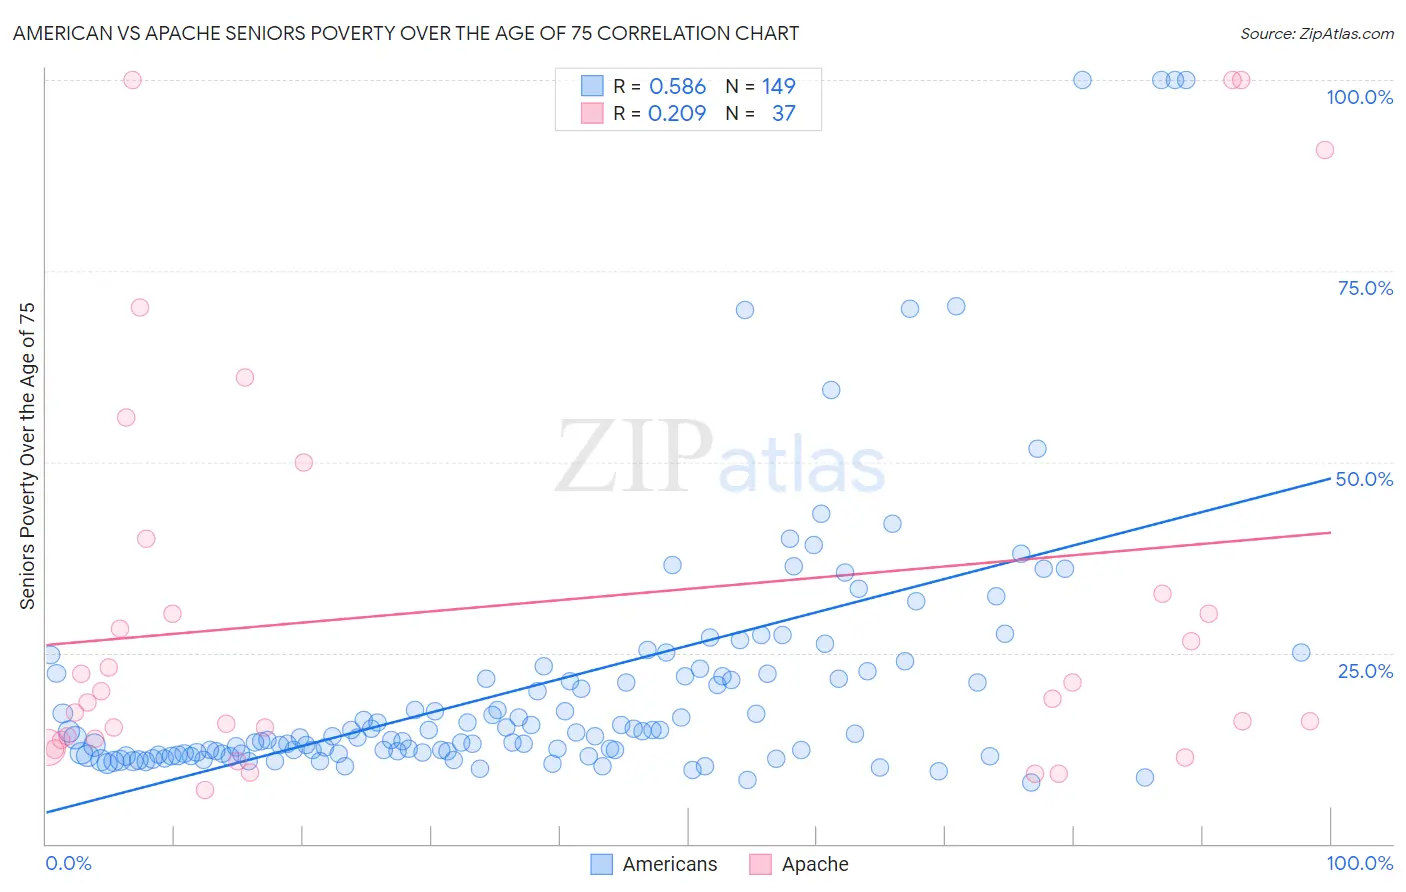
American vs Apache Seniors Poverty Over the Age of 75 Correlation Chart
The statistical analysis conducted on geographies consisting of 563,023,390 people shows a substantial positive correlation between the proportion of Americans and poverty level among seniors over the age of 75 in the United States with a correlation coefficient (R) of 0.586 and weighted average of 12.0%. Similarly, the statistical analysis conducted on geographies consisting of 229,385,853 people shows a weak positive correlation between the proportion of Apache and poverty level among seniors over the age of 75 in the United States with a correlation coefficient (R) of 0.209 and weighted average of 15.3%, a difference of 27.7%.
Seniors Poverty Over the Age of 75 Correlation Summary
| Measurement | American | Apache |
| Minimum | 8.0% | 7.0% |
| Maximum | 100.0% | 100.0% |
| Range | 92.0% | 93.0% |
| Mean | 20.9% | 31.3% |
| Median | 14.1% | 19.0% |
| Interquartile 25% (IQ1) | 11.8% | 13.7% |
| Interquartile 75% (IQ3) | 22.3% | 36.4% |
| Interquartile Range (IQR) | 10.5% | 22.7% |
| Standard Deviation (Sample) | 17.6% | 27.8% |
| Standard Deviation (Population) | 17.5% | 27.4% |
Similar Demographics by Seniors Poverty Over the Age of 75
Demographics Similar to Americans by Seniors Poverty Over the Age of 75
In terms of seniors poverty over the age of 75, the demographic groups most similar to Americans are Hmong (12.0%, a difference of 0.010%), Immigrants from Belgium (12.0%, a difference of 0.010%), Immigrants from Laos (12.0%, a difference of 0.050%), Bangladeshi (12.0%, a difference of 0.060%), and Immigrants from Cameroon (12.0%, a difference of 0.080%).
| Demographics | Rating | Rank | Seniors Poverty Over the Age of 75 |
| Immigrants | Philippines | 75.0 /100 | #136 | Good 11.9% |
| Immigrants | Moldova | 74.1 /100 | #137 | Good 11.9% |
| Immigrants | Romania | 72.6 /100 | #138 | Good 11.9% |
| Immigrants | Kenya | 72.6 /100 | #139 | Good 11.9% |
| Immigrants | Pakistan | 71.9 /100 | #140 | Good 12.0% |
| Immigrants | Cameroon | 71.7 /100 | #141 | Good 12.0% |
| Immigrants | Laos | 71.5 /100 | #142 | Good 12.0% |
| Americans | 71.0 /100 | #143 | Good 12.0% |
| Hmong | 70.8 /100 | #144 | Good 12.0% |
| Immigrants | Belgium | 70.8 /100 | #145 | Good 12.0% |
| Bangladeshis | 70.4 /100 | #146 | Good 12.0% |
| Immigrants | Latvia | 69.1 /100 | #147 | Good 12.0% |
| Immigrants | Zaire | 67.6 /100 | #148 | Good 12.0% |
| Asians | 67.4 /100 | #149 | Good 12.0% |
| Cypriots | 67.3 /100 | #150 | Good 12.0% |
Demographics Similar to Apache by Seniors Poverty Over the Age of 75
In terms of seniors poverty over the age of 75, the demographic groups most similar to Apache are Colville (15.2%, a difference of 0.40%), Immigrants from Jamaica (15.3%, a difference of 0.45%), Paiute (15.2%, a difference of 0.58%), Immigrants from the Azores (15.2%, a difference of 0.60%), and Immigrants from Belize (15.2%, a difference of 0.61%).
| Demographics | Rating | Rank | Seniors Poverty Over the Age of 75 |
| Immigrants | Central America | 0.0 /100 | #286 | Tragic 15.0% |
| Immigrants | Guatemala | 0.0 /100 | #287 | Tragic 15.1% |
| Jamaicans | 0.0 /100 | #288 | Tragic 15.1% |
| Immigrants | Belize | 0.0 /100 | #289 | Tragic 15.2% |
| Immigrants | Azores | 0.0 /100 | #290 | Tragic 15.2% |
| Paiute | 0.0 /100 | #291 | Tragic 15.2% |
| Colville | 0.0 /100 | #292 | Tragic 15.2% |
| Apache | 0.0 /100 | #293 | Tragic 15.3% |
| Immigrants | Jamaica | 0.0 /100 | #294 | Tragic 15.3% |
| U.S. Virgin Islanders | 0.0 /100 | #295 | Tragic 15.4% |
| Yuman | 0.0 /100 | #296 | Tragic 15.4% |
| Hondurans | 0.0 /100 | #297 | Tragic 15.4% |
| Natives/Alaskans | 0.0 /100 | #298 | Tragic 15.5% |
| Spanish American Indians | 0.0 /100 | #299 | Tragic 15.5% |
| Bahamians | 0.0 /100 | #300 | Tragic 15.5% |