Peruvian vs Immigrants from Liberia Single Male Poverty

COMPARE

Peruvian
Race
Ancestry
AfghanAfricanAlaska NativeAlaskan AthabascanAlbanianAleutAlsatianAmericanApacheArabArapahoArgentineanArmenianAssyrian/Chaldean/SyriacAustralianAustrianBahamianBangladeshiBarbadianBasqueBelgianBelizeanBermudanBhutaneseBlackfeetBolivianBrazilianBritishBritish West IndianBulgarianBurmeseCajunCambodianCanadianCape VerdeanCarpatho RusynCelticCentral AmericanCentral American IndianCherokeeCheyenneChickasawChileanChineseChippewaChoctawColombianColvilleComancheCosta RicanCreeCreekCroatianCrowCubanCypriotCzechCzechoslovakianDanishDelawareDominicanDutchDutch West IndianEastern EuropeanEcuadorianEgyptianEnglishEstonianEthiopianEuropeanFijianFilipinoFinnishFrenchFrench American IndianFrench CanadianGermanGerman RussianGhanaianGreekGuamanian/ChamorroGuatemalanGuyaneseHaitianHmongHonduranHopiHoumaHungarianIcelanderIndian (Asian)IndonesianInupiatIranianIraqiIrishIroquoisIsraeliItalianJamaicanJapaneseJordanianKenyanKiowaKoreanLaotianLatvianLebaneseLiberianLithuanianLumbeeLuxembourgerMacedonianMalaysianMalteseMarshalleseMenomineeMexicanMexican American IndianMongolianMoroccanNative HawaiianNavajoNepaleseNew ZealanderNicaraguanNigerianNorthern EuropeanNorwegianOkinawanOsageOttawaPaiutePakistaniPalestinianPanamanianParaguayanPennsylvania GermanPeruvianPimaPolishPortuguesePotawatomiPuebloPuerto RicanPuget Sound SalishRomanianRussianSalvadoranSamoanScandinavianScotch-IrishScottishSeminoleSenegaleseSerbianShoshoneSierra LeoneanSiouxSlavicSlovakSloveneSomaliSouth AfricanSouth AmericanSouth American IndianSoviet UnionSpaniardSpanishSpanish AmericanSpanish American IndianSri LankanSubsaharan AfricanSudaneseSwedishSwissSyrianTaiwaneseThaiTlingit-HaidaTohono O'OdhamTonganTrinidadian and TobagonianTsimshianTurkishU.S. Virgin IslanderUgandanUkrainianUruguayanUteVenezuelanVietnameseWelshWest IndianYakamaYaquiYugoslavianYumanYup'ikZimbabwean
Immigration
NonimmigrantsImmigrantsAfghanistanAfricaAlbaniaArgentinaArmeniaAsiaAustraliaAustriaBahamasBangladeshBarbadosBelarusBelgiumBelizeBoliviaBosnia and HerzegovinaBrazilBulgariaBurma/MyanmarCabo VerdeCambodiaCameroonCanadaCaribbeanCentral AmericaChileChinaColombiaCongoCosta RicaCroatiaCubaCzechoslovakiaDenmarkDominicaDominican RepublicEastern AfricaEastern AsiaEastern EuropeEcuadorEgyptEl SalvadorEnglandEritreaEthiopiaEuropeFijiFranceGermanyGhanaGreeceGrenadaGuatemalaGuyanaHaitiHondurasHong KongHungaryIndiaIndonesiaIranIraqIrelandIsraelItalyJamaicaJapanJordanKazakhstanKenyaKoreaKuwaitLaosLatin AmericaLatviaLebanonLithuaniaMalaysiaMexicoMicronesiaMiddle AfricaMoldovaMoroccoNepalNetherlandsNicaraguaNigeriaNorth AmericaNorth MacedoniaNorthern AfricaNorthern EuropeNorwayOceaniaPakistanPanamaPeruPhilippinesPolandPortugalRomaniaRussiaSaudi ArabiaScotlandSenegalSerbiaSierra LeoneSingaporeSomaliaSouth AfricaSouth AmericaSouth Central AsiaSouth Eastern AsiaSouthern EuropeSpainSri LankaSt. Vincent and the GrenadinesSudanSwedenSwitzerlandSyriaTaiwanThailandTrinidad and TobagoTurkeyUgandaUkraineUruguayUzbekistanVenezuelaVietnamWest IndiesWestern AfricaWestern AsiaWestern EuropeYemenZaireZimbabweAzores
Immigrants from Liberia
Race
Ancestry
AfghanAfricanAlaska NativeAlaskan AthabascanAlbanianAleutAlsatianAmericanApacheArabArapahoArgentineanArmenianAssyrian/Chaldean/SyriacAustralianAustrianBahamianBangladeshiBarbadianBasqueBelgianBelizeanBermudanBhutaneseBlackfeetBolivianBrazilianBritishBritish West IndianBulgarianBurmeseCajunCambodianCanadianCape VerdeanCarpatho RusynCelticCentral AmericanCentral American IndianCherokeeCheyenneChickasawChileanChineseChippewaChoctawColombianColvilleComancheCosta RicanCreeCreekCroatianCrowCubanCypriotCzechCzechoslovakianDanishDelawareDominicanDutchDutch West IndianEastern EuropeanEcuadorianEgyptianEnglishEstonianEthiopianEuropeanFijianFilipinoFinnishFrenchFrench American IndianFrench CanadianGermanGerman RussianGhanaianGreekGuamanian/ChamorroGuatemalanGuyaneseHaitianHmongHonduranHopiHoumaHungarianIcelanderIndian (Asian)IndonesianInupiatIranianIraqiIrishIroquoisIsraeliItalianJamaicanJapaneseJordanianKenyanKiowaKoreanLaotianLatvianLebaneseLiberianLithuanianLumbeeLuxembourgerMacedonianMalaysianMalteseMarshalleseMenomineeMexicanMexican American IndianMongolianMoroccanNative HawaiianNavajoNepaleseNew ZealanderNicaraguanNigerianNorthern EuropeanNorwegianOkinawanOsageOttawaPaiutePakistaniPalestinianPanamanianParaguayanPennsylvania GermanPimaPolishPortuguesePotawatomiPuebloPuerto RicanPuget Sound SalishRomanianRussianSalvadoranSamoanScandinavianScotch-IrishScottishSeminoleSenegaleseSerbianShoshoneSierra LeoneanSiouxSlavicSlovakSloveneSomaliSouth AfricanSouth AmericanSouth American IndianSoviet UnionSpaniardSpanishSpanish AmericanSpanish American IndianSri LankanSubsaharan AfricanSudaneseSwedishSwissSyrianTaiwaneseThaiTlingit-HaidaTohono O'OdhamTonganTrinidadian and TobagonianTsimshianTurkishU.S. Virgin IslanderUgandanUkrainianUruguayanUteVenezuelanVietnameseWelshWest IndianYakamaYaquiYugoslavianYumanYup'ikZimbabwean
Immigration
NonimmigrantsImmigrantsAfghanistanAfricaAlbaniaArgentinaArmeniaAsiaAustraliaAustriaBahamasBangladeshBarbadosBelarusBelgiumBelizeBoliviaBosnia and HerzegovinaBrazilBulgariaBurma/MyanmarCabo VerdeCambodiaCameroonCanadaCaribbeanCentral AmericaChileChinaColombiaCongoCosta RicaCroatiaCubaCzechoslovakiaDenmarkDominicaDominican RepublicEastern AfricaEastern AsiaEastern EuropeEcuadorEgyptEl SalvadorEnglandEritreaEthiopiaEuropeFijiFranceGermanyGhanaGreeceGrenadaGuatemalaGuyanaHaitiHondurasHong KongHungaryIndiaIndonesiaIranIraqIrelandIsraelItalyJamaicaJapanJordanKazakhstanKenyaKoreaKuwaitLaosLatin AmericaLatviaLebanonLiberiaLithuaniaMalaysiaMexicoMicronesiaMiddle AfricaMoldovaMoroccoNepalNetherlandsNicaraguaNigeriaNorth AmericaNorth MacedoniaNorthern AfricaNorthern EuropeNorwayOceaniaPakistanPanamaPeruPhilippinesPolandPortugalRomaniaRussiaSaudi ArabiaScotlandSenegalSerbiaSierra LeoneSingaporeSomaliaSouth AfricaSouth AmericaSouth Central AsiaSouth Eastern AsiaSouthern EuropeSpainSri LankaSt. Vincent and the GrenadinesSudanSwedenSwitzerlandSyriaTaiwanThailandTrinidad and TobagoTurkeyUgandaUkraineUruguayUzbekistanVenezuelaVietnamWest IndiesWestern AfricaWestern AsiaWestern EuropeYemenZaireZimbabweAzores
Single Male Poverty
Income
Poverty
Unemployment
Labor Participation
Family Structure
Vehicle Availability
Education Level
Disability

Single Male Poverty Comparison

Peruvians

Immigrants from Liberia

Exceptional
Good
11.8%
SINGLE MALE POVERTY
99.8/ 100
METRIC RATING
60th/ 347
METRIC RANK
12.7%
SINGLE MALE POVERTY
64.2/ 100
METRIC RATING
159th/ 347
METRIC RANK

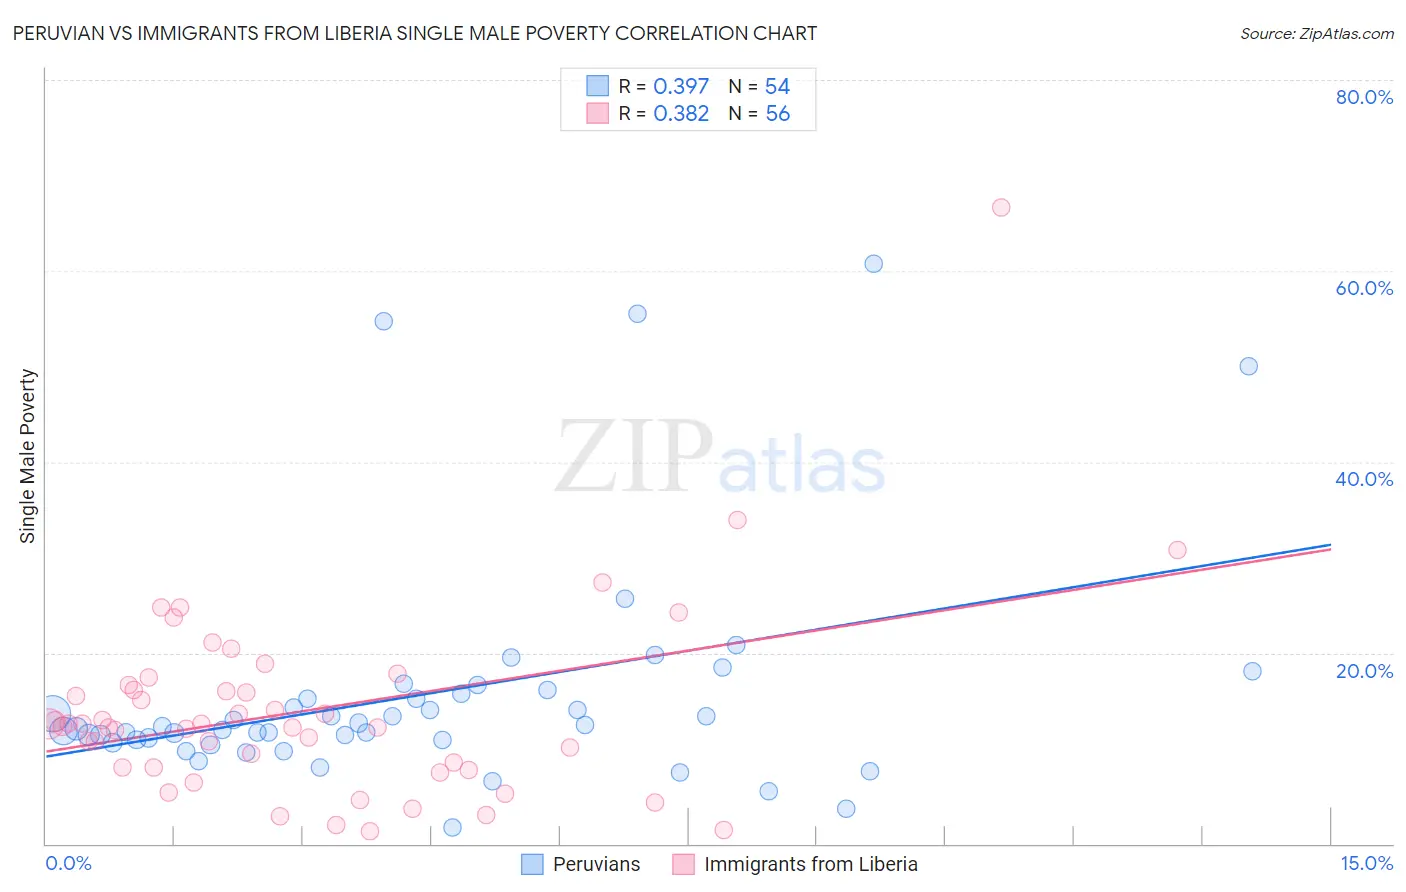
Peruvian vs Immigrants from Liberia Single Male Poverty Correlation Chart

The statistical analysis conducted on geographies consisting of 326,481,306 people shows a mild positive correlation between the proportion of Peruvians and poverty level among single males in the United States with a correlation coefficient (R) of 0.397 and weighted average of 11.8%. Similarly, the statistical analysis conducted on geographies consisting of 128,507,837 people shows a mild positive correlation between the proportion of Immigrants from Liberia and poverty level among single males in the United States with a correlation coefficient (R) of 0.382 and weighted average of 12.7%, a difference of 7.8%.
Peruvian vs Immigrants from Liberia Single Male Poverty

Single Male Poverty Correlation Summary

MeasurementPeruvianImmigrants from Liberia
Minimum1.7%1.3%
Maximum60.7%66.7%
Range59.0%65.4%
Mean15.6%13.9%
Median12.1%12.4%
Interquartile 25% (IQ1)10.9%8.0%
Interquartile 75% (IQ3)15.7%16.4%
Interquartile Range (IQR)4.8%8.3%
Standard Deviation (Sample)12.1%10.2%
Standard Deviation (Population)12.0%10.1%

Similar Demographics by Single Male Poverty

Demographics Similar to Peruvians by Single Male Poverty

In terms of single male poverty, the demographic groups most similar to Peruvians are Cambodian (11.8%, a difference of 0.020%), Brazilian (11.8%, a difference of 0.21%), Immigrants from Brazil (11.7%, a difference of 0.29%), Immigrants from Romania (11.7%, a difference of 0.32%), and Immigrants from Sri Lanka (11.8%, a difference of 0.40%).
DemographicsRating | RankSingle Male Poverty
Bulgarians
99.9
/100
|
#53
Exceptional
11.7%
Immigrants | Uzbekistan
99.9
/100
|
#54
Exceptional
11.7%
Cypriots
99.9
/100
|
#55
Exceptional
11.7%
Burmese
99.8
/100
|
#56
Exceptional
11.7%
Immigrants | Romania
99.8
/100
|
#57
Exceptional
11.7%
Immigrants | Brazil
99.8
/100
|
#58
Exceptional
11.7%
Brazilians
99.8
/100
|
#59
Exceptional
11.8%
Peruvians
99.8
/100
|
#60
Exceptional
11.8%
Cambodians
99.8
/100
|
#61
Exceptional
11.8%
Immigrants | Sri Lanka
99.7
/100
|
#62
Exceptional
11.8%
Immigrants | Belarus
99.7
/100
|
#63
Exceptional
11.8%
Immigrants | Eastern Europe
99.6
/100
|
#64
Exceptional
11.8%
Laotians
99.6
/100
|
#65
Exceptional
11.9%
Immigrants | Uruguay
99.6
/100
|
#66
Exceptional
11.9%
Immigrants | Ukraine
99.6
/100
|
#67
Exceptional
11.9%

Demographics Similar to Immigrants from Liberia by Single Male Poverty

In terms of single male poverty, the demographic groups most similar to Immigrants from Liberia are Greek (12.7%, a difference of 0.0%), Immigrants from Middle Africa (12.7%, a difference of 0.040%), Immigrants from Africa (12.7%, a difference of 0.040%), Eastern European (12.7%, a difference of 0.050%), and Palestinian (12.7%, a difference of 0.060%).
DemographicsRating | RankSingle Male Poverty
Australians
71.4
/100
|
#152
Good
12.6%
Immigrants | Immigrants
70.1
/100
|
#153
Good
12.7%
Immigrants | Scotland
68.9
/100
|
#154
Good
12.7%
Immigrants | Spain
68.7
/100
|
#155
Good
12.7%
Vietnamese
67.9
/100
|
#156
Good
12.7%
Latvians
67.9
/100
|
#157
Good
12.7%
Immigrants | Middle Africa
64.9
/100
|
#158
Good
12.7%
Immigrants | Liberia
64.2
/100
|
#159
Good
12.7%
Greeks
64.1
/100
|
#160
Good
12.7%
Immigrants | Africa
63.4
/100
|
#161
Good
12.7%
Eastern Europeans
63.3
/100
|
#162
Good
12.7%
Palestinians
63.1
/100
|
#163
Good
12.7%
Immigrants | Nigeria
62.8
/100
|
#164
Good
12.7%
Immigrants | Cambodia
62.2
/100
|
#165
Good
12.7%
Immigrants | Guyana
60.5
/100
|
#166
Good
12.7%