Immigrants from St. Vincent and the Grenadines vs Kenyan Female Poverty Among 25-34 Year Olds
COMPARE
Immigrants from St. Vincent and the Grenadines
Kenyan
Female Poverty Among 25-34 Year Olds
Female Poverty Among 25-34 Year Olds Comparison
Immigrants from St. Vincent and the Grenadines
Kenyans
13.8%
FEMALE POVERTY AMONG 25-34 YEAR OLDS
29.3/ 100
METRIC RATING
191st/ 347
METRIC RANK
13.5%
FEMALE POVERTY AMONG 25-34 YEAR OLDS
51.8/ 100
METRIC RATING
173rd/ 347
METRIC RANK
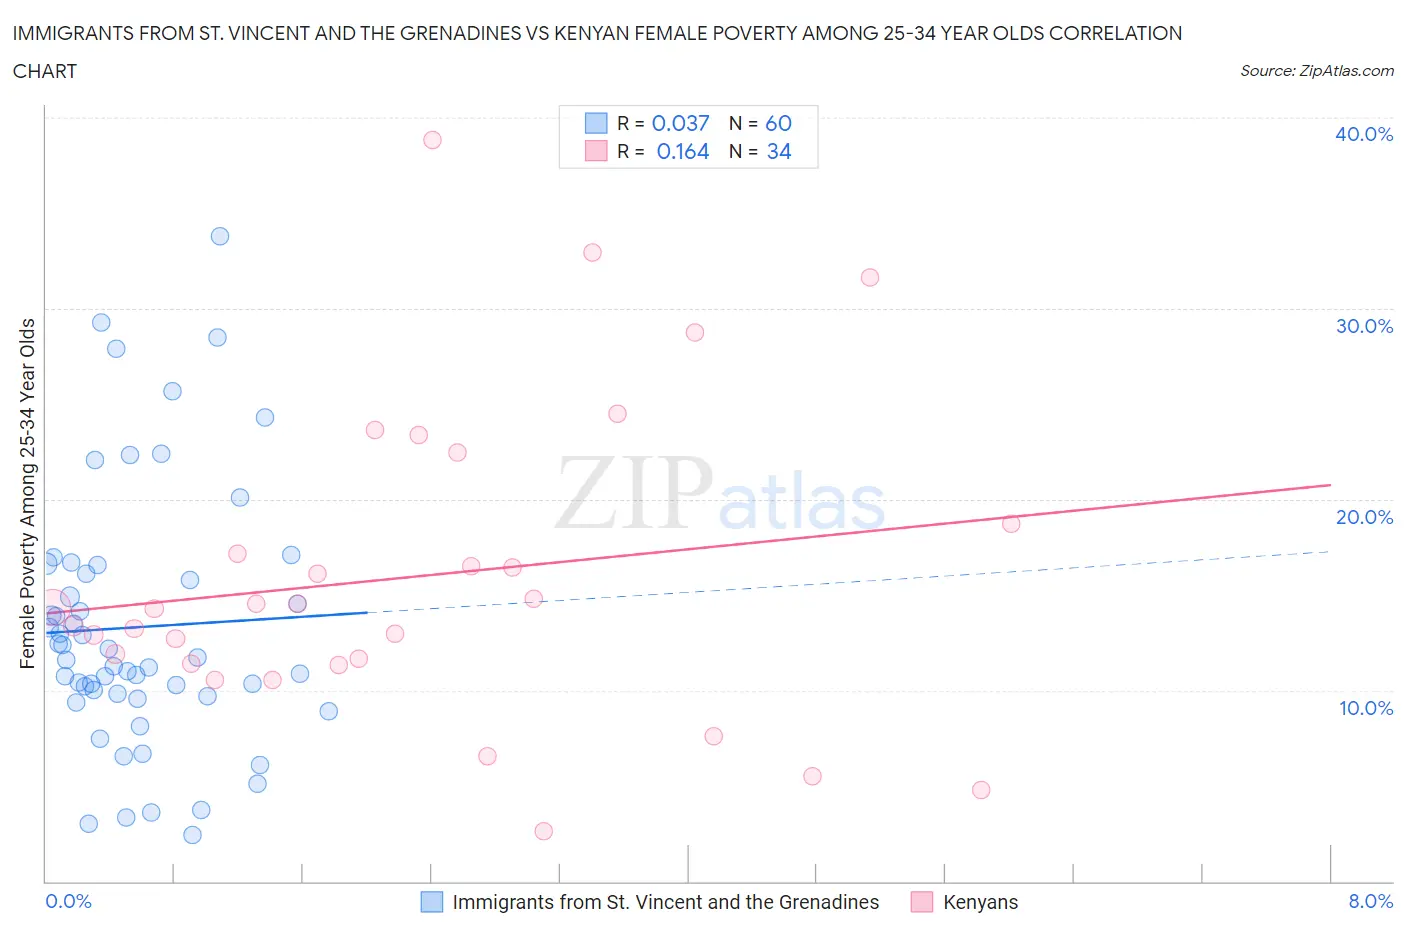
Immigrants from St. Vincent and the Grenadines vs Kenyan Female Poverty Among 25-34 Year Olds Correlation Chart
The statistical analysis conducted on geographies consisting of 55,954,264 people shows no correlation between the proportion of Immigrants from St. Vincent and the Grenadines and poverty level among females between the ages 25 and 34 in the United States with a correlation coefficient (R) of 0.037 and weighted average of 13.8%. Similarly, the statistical analysis conducted on geographies consisting of 167,556,876 people shows a poor positive correlation between the proportion of Kenyans and poverty level among females between the ages 25 and 34 in the United States with a correlation coefficient (R) of 0.164 and weighted average of 13.5%, a difference of 2.0%.
Female Poverty Among 25-34 Year Olds Correlation Summary
| Measurement | Immigrants from St. Vincent and the Grenadines | Kenyan |
| Minimum | 2.4% | 2.6% |
| Maximum | 33.8% | 38.8% |
| Range | 31.4% | 36.2% |
| Mean | 13.3% | 16.0% |
| Median | 11.6% | 14.3% |
| Interquartile 25% (IQ1) | 9.8% | 11.4% |
| Interquartile 75% (IQ3) | 16.3% | 18.8% |
| Interquartile Range (IQR) | 6.6% | 7.3% |
| Standard Deviation (Sample) | 6.8% | 8.2% |
| Standard Deviation (Population) | 6.7% | 8.1% |
Demographics Similar to Immigrants from St. Vincent and the Grenadines and Kenyans by Female Poverty Among 25-34 Year Olds
In terms of female poverty among 25-34 year olds, the demographic groups most similar to Immigrants from St. Vincent and the Grenadines are Dutch (13.8%, a difference of 0.040%), Tlingit-Haida (13.8%, a difference of 0.12%), Finnish (13.7%, a difference of 0.30%), Immigrants from Eritrea (13.7%, a difference of 0.32%), and Immigrants from Uruguay (13.7%, a difference of 0.45%). Similarly, the demographic groups most similar to Kenyans are Immigrants from Costa Rica (13.5%, a difference of 0.010%), Immigrants from Oceania (13.5%, a difference of 0.15%), Bermudan (13.6%, a difference of 0.41%), Yugoslavian (13.6%, a difference of 0.57%), and Venezuelan (13.6%, a difference of 0.60%).
| Demographics | Rating | Rank | Female Poverty Among 25-34 Year Olds |
| Immigrants | Costa Rica | 51.9 /100 | #172 | Average 13.5% |
| Kenyans | 51.8 /100 | #173 | Average 13.5% |
| Immigrants | Oceania | 50.0 /100 | #174 | Average 13.5% |
| Bermudans | 46.8 /100 | #175 | Average 13.6% |
| Yugoslavians | 45.0 /100 | #176 | Average 13.6% |
| Venezuelans | 44.6 /100 | #177 | Average 13.6% |
| Canadians | 44.3 /100 | #178 | Average 13.6% |
| Immigrants | Eastern Africa | 43.6 /100 | #179 | Average 13.6% |
| Germans | 41.6 /100 | #180 | Average 13.6% |
| Guamanians/Chamorros | 41.5 /100 | #181 | Average 13.6% |
| Immigrants | Venezuela | 40.7 /100 | #182 | Average 13.6% |
| Portuguese | 40.3 /100 | #183 | Average 13.6% |
| Czechoslovakians | 36.8 /100 | #184 | Fair 13.7% |
| Irish | 35.3 /100 | #185 | Fair 13.7% |
| Immigrants | Uruguay | 34.1 /100 | #186 | Fair 13.7% |
| Slovaks | 34.1 /100 | #187 | Fair 13.7% |
| Immigrants | Eritrea | 32.7 /100 | #188 | Fair 13.7% |
| Finns | 32.5 /100 | #189 | Fair 13.7% |
| Dutch | 29.7 /100 | #190 | Fair 13.8% |
| Immigrants | St. Vincent and the Grenadines | 29.3 /100 | #191 | Fair 13.8% |
| Tlingit-Haida | 28.1 /100 | #192 | Fair 13.8% |