Paraguayan vs Immigrants from Honduras Unemployment Among Ages 45 to 54 years
COMPARE
Paraguayan
Immigrants from Honduras
Unemployment Among Ages 45 to 54 years
Unemployment Among Ages 45 to 54 years Comparison
Paraguayans
Immigrants from Honduras
4.3%
UNEMPLOYMENT AMONG AGES 45 TO 54 YEARS
98.6/ 100
METRIC RATING
70th/ 347
METRIC RANK
4.8%
UNEMPLOYMENT AMONG AGES 45 TO 54 YEARS
0.7/ 100
METRIC RATING
249th/ 347
METRIC RANK
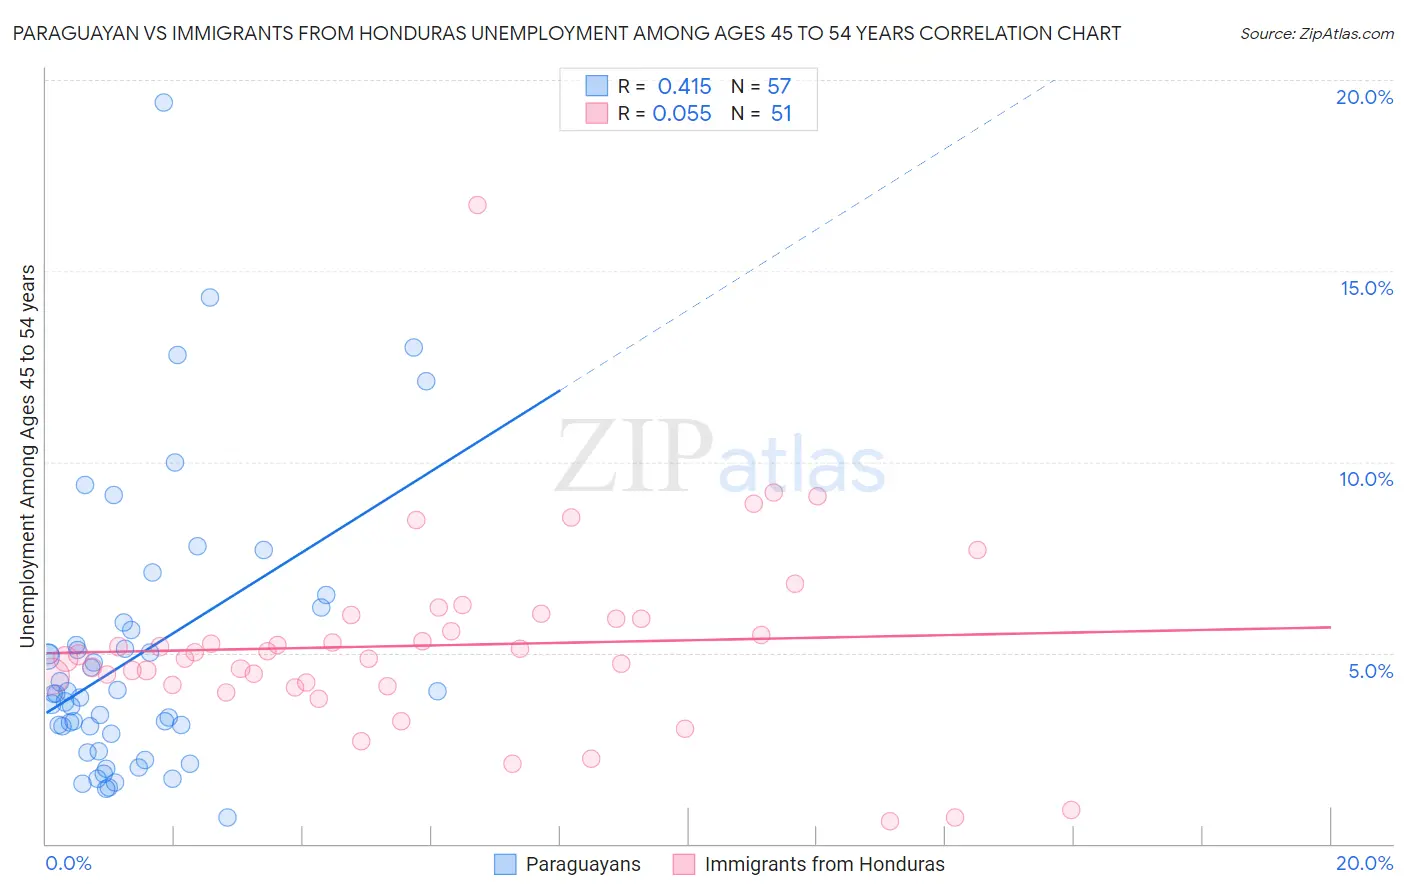
Paraguayan vs Immigrants from Honduras Unemployment Among Ages 45 to 54 years Correlation Chart
The statistical analysis conducted on geographies consisting of 94,646,990 people shows a moderate positive correlation between the proportion of Paraguayans and unemployment rate among population between the ages 45 and 54 in the United States with a correlation coefficient (R) of 0.415 and weighted average of 4.3%. Similarly, the statistical analysis conducted on geographies consisting of 316,788,691 people shows a slight positive correlation between the proportion of Immigrants from Honduras and unemployment rate among population between the ages 45 and 54 in the United States with a correlation coefficient (R) of 0.055 and weighted average of 4.8%, a difference of 11.3%.
Unemployment Among Ages 45 to 54 years Correlation Summary
| Measurement | Paraguayan | Immigrants from Honduras |
| Minimum | 0.70% | 0.60% |
| Maximum | 19.4% | 16.7% |
| Range | 18.7% | 16.1% |
| Mean | 4.9% | 5.2% |
| Median | 3.9% | 4.9% |
| Interquartile 25% (IQ1) | 2.7% | 4.1% |
| Interquartile 75% (IQ3) | 5.7% | 5.9% |
| Interquartile Range (IQR) | 3.0% | 1.8% |
| Standard Deviation (Sample) | 3.7% | 2.5% |
| Standard Deviation (Population) | 3.6% | 2.5% |
Similar Demographics by Unemployment Among Ages 45 to 54 years
Demographics Similar to Paraguayans by Unemployment Among Ages 45 to 54 years
In terms of unemployment among ages 45 to 54 years, the demographic groups most similar to Paraguayans are Palestinian (4.3%, a difference of 0.080%), White/Caucasian (4.3%, a difference of 0.11%), Immigrants from Japan (4.3%, a difference of 0.14%), Slovak (4.3%, a difference of 0.27%), and Canadian (4.3%, a difference of 0.28%).
| Demographics | Rating | Rank | Unemployment Among Ages 45 to 54 years |
| Pennsylvania Germans | 99.1 /100 | #63 | Exceptional 4.3% |
| Austrians | 99.0 /100 | #64 | Exceptional 4.3% |
| Immigrants | Sudan | 99.0 /100 | #65 | Exceptional 4.3% |
| Turks | 98.9 /100 | #66 | Exceptional 4.3% |
| Immigrants | Nepal | 98.9 /100 | #67 | Exceptional 4.3% |
| Slovaks | 98.8 /100 | #68 | Exceptional 4.3% |
| Immigrants | Japan | 98.7 /100 | #69 | Exceptional 4.3% |
| Paraguayans | 98.6 /100 | #70 | Exceptional 4.3% |
| Palestinians | 98.5 /100 | #71 | Exceptional 4.3% |
| Whites/Caucasians | 98.4 /100 | #72 | Exceptional 4.3% |
| Canadians | 98.2 /100 | #73 | Exceptional 4.3% |
| Immigrants | Belgium | 98.2 /100 | #74 | Exceptional 4.3% |
| Kenyans | 98.1 /100 | #75 | Exceptional 4.3% |
| Slavs | 98.1 /100 | #76 | Exceptional 4.3% |
| Chileans | 98.1 /100 | #77 | Exceptional 4.3% |
Demographics Similar to Immigrants from Honduras by Unemployment Among Ages 45 to 54 years
In terms of unemployment among ages 45 to 54 years, the demographic groups most similar to Immigrants from Honduras are Salvadoran (4.8%, a difference of 0.070%), Immigrants from Liberia (4.8%, a difference of 0.17%), Israeli (4.8%, a difference of 0.28%), Immigrants from Syria (4.8%, a difference of 0.33%), and Immigrants from Albania (4.8%, a difference of 0.34%).
| Demographics | Rating | Rank | Unemployment Among Ages 45 to 54 years |
| Central Americans | 1.3 /100 | #242 | Tragic 4.8% |
| Portuguese | 1.1 /100 | #243 | Tragic 4.8% |
| Seminole | 1.1 /100 | #244 | Tragic 4.8% |
| Immigrants | Albania | 0.9 /100 | #245 | Tragic 4.8% |
| Immigrants | Syria | 0.9 /100 | #246 | Tragic 4.8% |
| Israelis | 0.9 /100 | #247 | Tragic 4.8% |
| Immigrants | Liberia | 0.8 /100 | #248 | Tragic 4.8% |
| Immigrants | Honduras | 0.7 /100 | #249 | Tragic 4.8% |
| Salvadorans | 0.7 /100 | #250 | Tragic 4.8% |
| Hondurans | 0.4 /100 | #251 | Tragic 4.8% |
| Immigrants | Bahamas | 0.3 /100 | #252 | Tragic 4.8% |
| Moroccans | 0.3 /100 | #253 | Tragic 4.8% |
| Immigrants | Lebanon | 0.2 /100 | #254 | Tragic 4.8% |
| Immigrants | El Salvador | 0.2 /100 | #255 | Tragic 4.8% |
| Immigrants | Western Asia | 0.2 /100 | #256 | Tragic 4.8% |