Paraguayan vs Immigrants from Dominica Female Poverty Among 18-24 Year Olds
COMPARE
Paraguayan
Immigrants from Dominica
Female Poverty Among 18-24 Year Olds
Female Poverty Among 18-24 Year Olds Comparison
Paraguayans
Immigrants from Dominica
19.4%
FEMALE POVERTY AMONG 18-24 YEAR OLDS
94.6/ 100
METRIC RATING
123rd/ 347
METRIC RANK
21.9%
FEMALE POVERTY AMONG 18-24 YEAR OLDS
0.1/ 100
METRIC RATING
280th/ 347
METRIC RANK
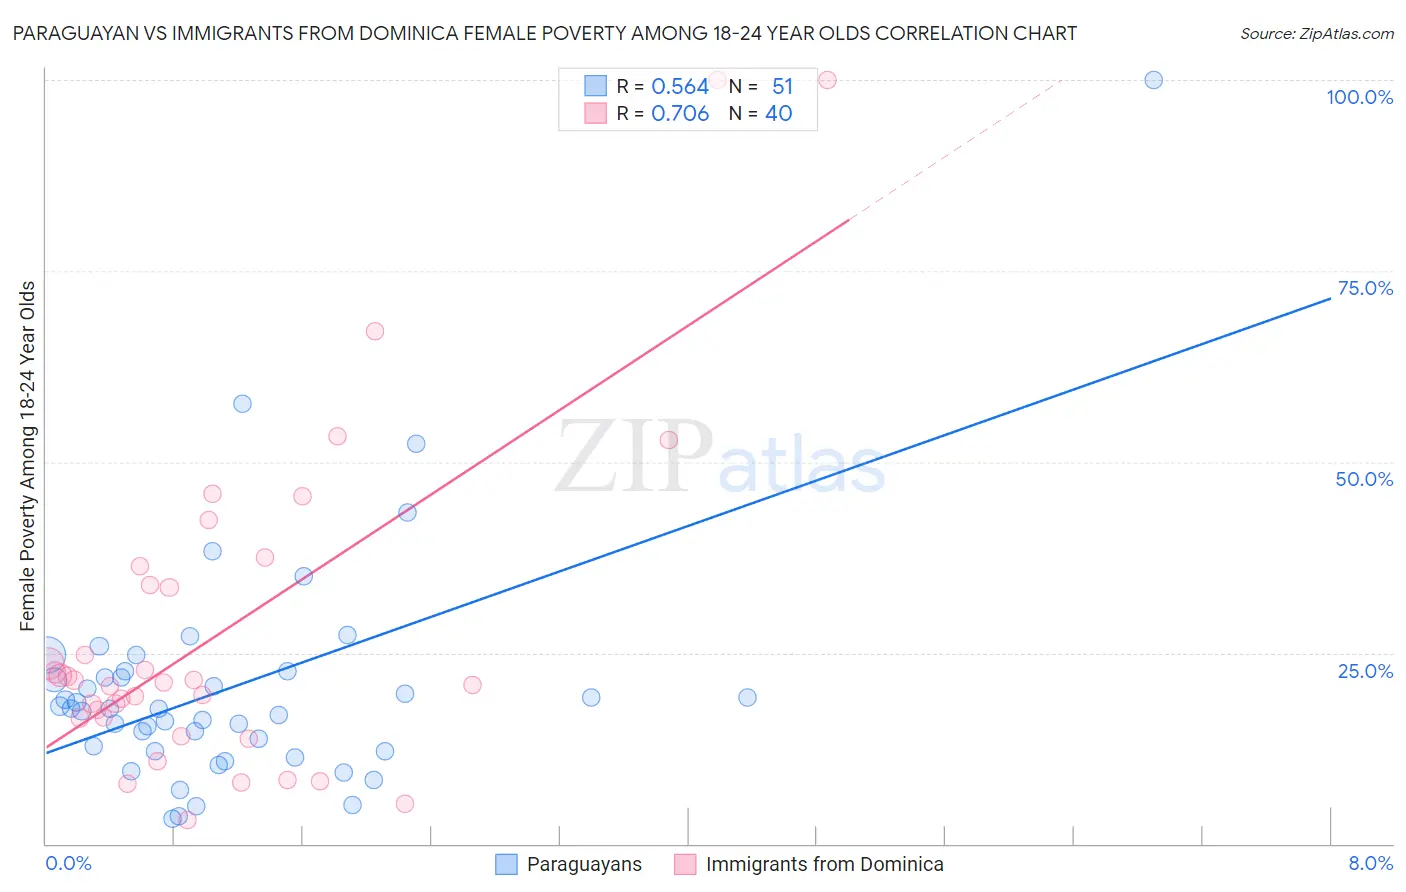
Paraguayan vs Immigrants from Dominica Female Poverty Among 18-24 Year Olds Correlation Chart
The statistical analysis conducted on geographies consisting of 94,427,228 people shows a substantial positive correlation between the proportion of Paraguayans and poverty level among females between the ages 18 and 24 in the United States with a correlation coefficient (R) of 0.564 and weighted average of 19.4%. Similarly, the statistical analysis conducted on geographies consisting of 83,465,633 people shows a strong positive correlation between the proportion of Immigrants from Dominica and poverty level among females between the ages 18 and 24 in the United States with a correlation coefficient (R) of 0.706 and weighted average of 21.9%, a difference of 13.0%.
Female Poverty Among 18-24 Year Olds Correlation Summary
| Measurement | Paraguayan | Immigrants from Dominica |
| Minimum | 3.3% | 3.1% |
| Maximum | 100.0% | 100.0% |
| Range | 96.7% | 96.9% |
| Mean | 20.6% | 27.9% |
| Median | 17.7% | 21.3% |
| Interquartile 25% (IQ1) | 12.2% | 16.5% |
| Interquartile 75% (IQ3) | 22.5% | 35.0% |
| Interquartile Range (IQR) | 10.4% | 18.6% |
| Standard Deviation (Sample) | 15.7% | 22.0% |
| Standard Deviation (Population) | 15.6% | 21.7% |
Similar Demographics by Female Poverty Among 18-24 Year Olds
Demographics Similar to Paraguayans by Female Poverty Among 18-24 Year Olds
In terms of female poverty among 18-24 year olds, the demographic groups most similar to Paraguayans are Cambodian (19.4%, a difference of 0.010%), Immigrants from Chile (19.4%, a difference of 0.070%), Immigrants from Panama (19.4%, a difference of 0.13%), Guyanese (19.4%, a difference of 0.20%), and Immigrants from Russia (19.4%, a difference of 0.20%).
| Demographics | Rating | Rank | Female Poverty Among 18-24 Year Olds |
| Immigrants | Immigrants | 95.9 /100 | #116 | Exceptional 19.3% |
| Immigrants | Iran | 95.8 /100 | #117 | Exceptional 19.3% |
| Immigrants | Guyana | 95.6 /100 | #118 | Exceptional 19.3% |
| Cypriots | 95.5 /100 | #119 | Exceptional 19.3% |
| Immigrants | Northern Europe | 95.4 /100 | #120 | Exceptional 19.4% |
| Guyanese | 95.3 /100 | #121 | Exceptional 19.4% |
| Cambodians | 94.6 /100 | #122 | Exceptional 19.4% |
| Paraguayans | 94.6 /100 | #123 | Exceptional 19.4% |
| Immigrants | Chile | 94.3 /100 | #124 | Exceptional 19.4% |
| Immigrants | Panama | 94.0 /100 | #125 | Exceptional 19.4% |
| Immigrants | Russia | 93.7 /100 | #126 | Exceptional 19.4% |
| Cape Verdeans | 93.6 /100 | #127 | Exceptional 19.4% |
| Slovaks | 92.9 /100 | #128 | Exceptional 19.5% |
| Immigrants | England | 92.9 /100 | #129 | Exceptional 19.5% |
| Immigrants | Canada | 92.9 /100 | #130 | Exceptional 19.5% |
Demographics Similar to Immigrants from Dominica by Female Poverty Among 18-24 Year Olds
In terms of female poverty among 18-24 year olds, the demographic groups most similar to Immigrants from Dominica are Spanish American (21.9%, a difference of 0.010%), Immigrants from Dominican Republic (21.9%, a difference of 0.040%), Bermudan (21.9%, a difference of 0.13%), Yaqui (21.9%, a difference of 0.18%), and Subsaharan African (22.0%, a difference of 0.43%).
| Demographics | Rating | Rank | Female Poverty Among 18-24 Year Olds |
| New Zealanders | 0.2 /100 | #273 | Tragic 21.7% |
| Immigrants | Honduras | 0.1 /100 | #274 | Tragic 21.8% |
| Immigrants | Bangladesh | 0.1 /100 | #275 | Tragic 21.8% |
| Bahamians | 0.1 /100 | #276 | Tragic 21.8% |
| Immigrants | Switzerland | 0.1 /100 | #277 | Tragic 21.8% |
| Yaqui | 0.1 /100 | #278 | Tragic 21.9% |
| Spanish Americans | 0.1 /100 | #279 | Tragic 21.9% |
| Immigrants | Dominica | 0.1 /100 | #280 | Tragic 21.9% |
| Immigrants | Dominican Republic | 0.1 /100 | #281 | Tragic 21.9% |
| Bermudans | 0.1 /100 | #282 | Tragic 21.9% |
| Sub-Saharan Africans | 0.0 /100 | #283 | Tragic 22.0% |
| Tlingit-Haida | 0.0 /100 | #284 | Tragic 22.0% |
| Ottawa | 0.0 /100 | #285 | Tragic 22.0% |
| Ugandans | 0.0 /100 | #286 | Tragic 22.1% |
| Immigrants | Middle Africa | 0.0 /100 | #287 | Tragic 22.1% |