Panamanian vs Cambodian Female Poverty Among 25-34 Year Olds
COMPARE
Panamanian
Cambodian
Female Poverty Among 25-34 Year Olds
Female Poverty Among 25-34 Year Olds Comparison
Panamanians
Cambodians
14.2%
FEMALE POVERTY AMONG 25-34 YEAR OLDS
8.6/ 100
METRIC RATING
210th/ 347
METRIC RANK
11.7%
FEMALE POVERTY AMONG 25-34 YEAR OLDS
99.9/ 100
METRIC RATING
35th/ 347
METRIC RANK
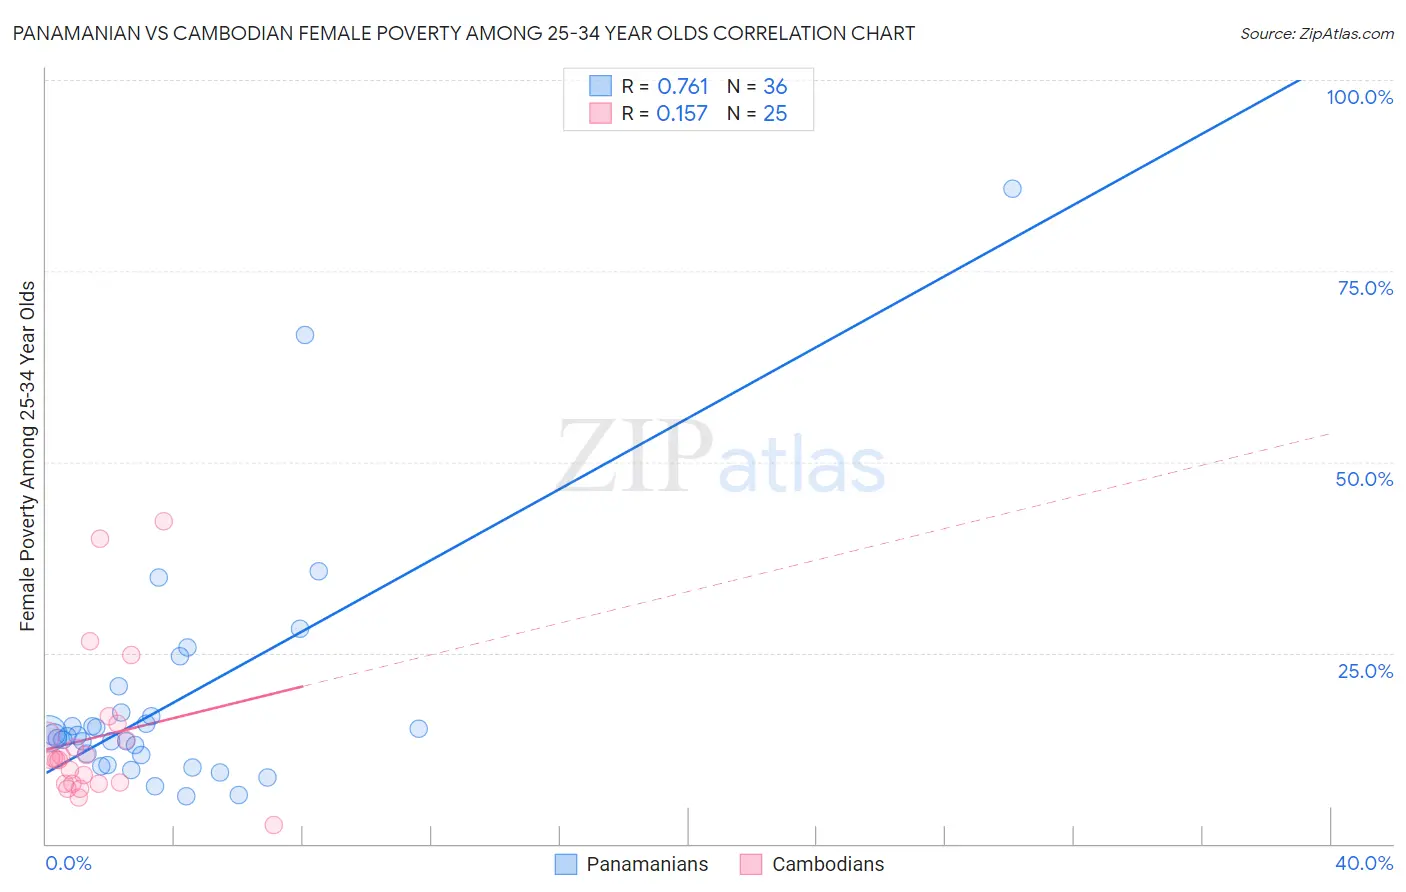
Panamanian vs Cambodian Female Poverty Among 25-34 Year Olds Correlation Chart
The statistical analysis conducted on geographies consisting of 279,201,773 people shows a strong positive correlation between the proportion of Panamanians and poverty level among females between the ages 25 and 34 in the United States with a correlation coefficient (R) of 0.761 and weighted average of 14.2%. Similarly, the statistical analysis conducted on geographies consisting of 102,197,555 people shows a poor positive correlation between the proportion of Cambodians and poverty level among females between the ages 25 and 34 in the United States with a correlation coefficient (R) of 0.157 and weighted average of 11.7%, a difference of 21.4%.
Female Poverty Among 25-34 Year Olds Correlation Summary
| Measurement | Panamanian | Cambodian |
| Minimum | 6.2% | 2.5% |
| Maximum | 85.7% | 42.2% |
| Range | 79.5% | 39.7% |
| Mean | 18.7% | 13.9% |
| Median | 14.1% | 11.1% |
| Interquartile 25% (IQ1) | 11.0% | 7.9% |
| Interquartile 75% (IQ3) | 16.9% | 14.9% |
| Interquartile Range (IQR) | 5.9% | 7.0% |
| Standard Deviation (Sample) | 15.9% | 9.8% |
| Standard Deviation (Population) | 15.7% | 9.6% |
Similar Demographics by Female Poverty Among 25-34 Year Olds
Demographics Similar to Panamanians by Female Poverty Among 25-34 Year Olds
In terms of female poverty among 25-34 year olds, the demographic groups most similar to Panamanians are Guyanese (14.2%, a difference of 0.010%), Trinidadian and Tobagonian (14.2%, a difference of 0.12%), Immigrants from Guyana (14.3%, a difference of 0.57%), Puget Sound Salish (14.3%, a difference of 0.59%), and Immigrants from Panama (14.1%, a difference of 0.66%).
| Demographics | Rating | Rank | Female Poverty Among 25-34 Year Olds |
| Immigrants | Immigrants | 14.5 /100 | #203 | Poor 14.0% |
| Hawaiians | 13.6 /100 | #204 | Poor 14.1% |
| Immigrants | Africa | 13.4 /100 | #205 | Poor 14.1% |
| Hungarians | 11.8 /100 | #206 | Poor 14.1% |
| Japanese | 11.7 /100 | #207 | Poor 14.1% |
| Immigrants | Panama | 11.6 /100 | #208 | Poor 14.1% |
| Guyanese | 8.6 /100 | #209 | Tragic 14.2% |
| Panamanians | 8.6 /100 | #210 | Tragic 14.2% |
| Trinidadians and Tobagonians | 8.2 /100 | #211 | Tragic 14.2% |
| Immigrants | Guyana | 6.6 /100 | #212 | Tragic 14.3% |
| Puget Sound Salish | 6.5 /100 | #213 | Tragic 14.3% |
| French | 6.2 /100 | #214 | Tragic 14.3% |
| Immigrants | Nigeria | 6.2 /100 | #215 | Tragic 14.3% |
| French Canadians | 5.5 /100 | #216 | Tragic 14.3% |
| Spanish American Indians | 5.5 /100 | #217 | Tragic 14.3% |
Demographics Similar to Cambodians by Female Poverty Among 25-34 Year Olds
In terms of female poverty among 25-34 year olds, the demographic groups most similar to Cambodians are Zimbabwean (11.7%, a difference of 0.27%), Immigrants from Poland (11.6%, a difference of 0.49%), Immigrants from Sri Lanka (11.8%, a difference of 0.49%), Taiwanese (11.8%, a difference of 0.65%), and Immigrants from North Macedonia (11.8%, a difference of 0.72%).
| Demographics | Rating | Rank | Female Poverty Among 25-34 Year Olds |
| Immigrants | Pakistan | 99.9 /100 | #28 | Exceptional 11.5% |
| Bulgarians | 99.9 /100 | #29 | Exceptional 11.5% |
| Cypriots | 99.9 /100 | #30 | Exceptional 11.5% |
| Immigrants | Japan | 99.9 /100 | #31 | Exceptional 11.6% |
| Immigrants | Asia | 99.9 /100 | #32 | Exceptional 11.6% |
| Immigrants | Poland | 99.9 /100 | #33 | Exceptional 11.6% |
| Zimbabweans | 99.9 /100 | #34 | Exceptional 11.7% |
| Cambodians | 99.9 /100 | #35 | Exceptional 11.7% |
| Immigrants | Sri Lanka | 99.8 /100 | #36 | Exceptional 11.8% |
| Taiwanese | 99.8 /100 | #37 | Exceptional 11.8% |
| Immigrants | North Macedonia | 99.8 /100 | #38 | Exceptional 11.8% |
| Latvians | 99.8 /100 | #39 | Exceptional 11.8% |
| Immigrants | Bulgaria | 99.8 /100 | #40 | Exceptional 11.8% |
| Immigrants | Indonesia | 99.8 /100 | #41 | Exceptional 11.8% |
| Immigrants | Turkey | 99.7 /100 | #42 | Exceptional 11.9% |