Pakistani vs Nepalese Single Mother Poverty
COMPARE
Pakistani
Nepalese
Single Mother Poverty
Single Mother Poverty Comparison
Pakistanis
Nepalese
28.0%
SINGLE MOTHER POVERTY
96.9/ 100
METRIC RATING
101st/ 347
METRIC RANK
29.3%
SINGLE MOTHER POVERTY
38.3/ 100
METRIC RATING
183rd/ 347
METRIC RANK
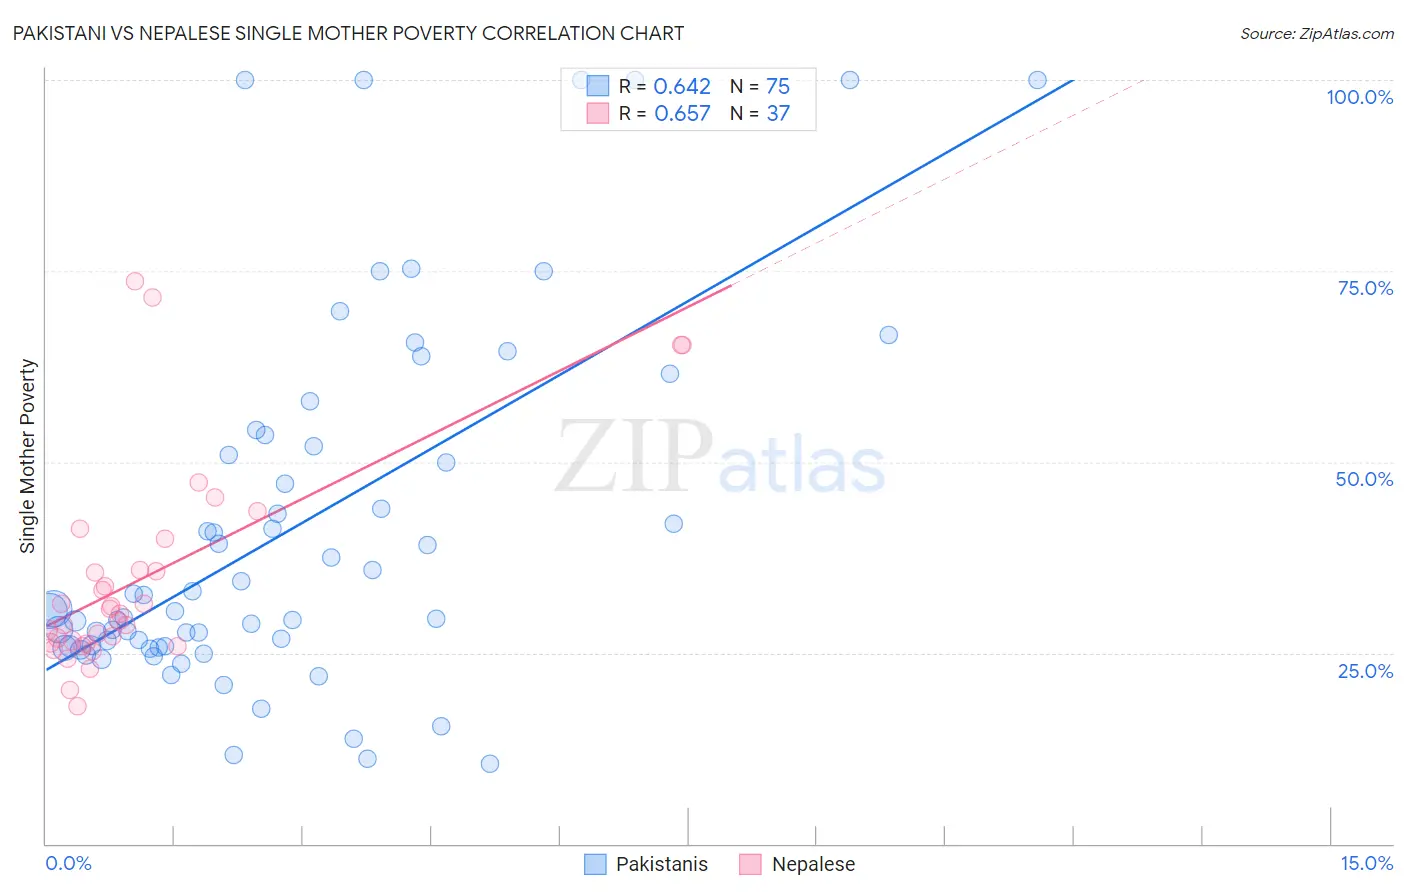
Pakistani vs Nepalese Single Mother Poverty Correlation Chart
The statistical analysis conducted on geographies consisting of 329,467,597 people shows a significant positive correlation between the proportion of Pakistanis and poverty level among single mothers in the United States with a correlation coefficient (R) of 0.642 and weighted average of 28.0%. Similarly, the statistical analysis conducted on geographies consisting of 24,439,991 people shows a significant positive correlation between the proportion of Nepalese and poverty level among single mothers in the United States with a correlation coefficient (R) of 0.657 and weighted average of 29.3%, a difference of 4.9%.
Single Mother Poverty Correlation Summary
| Measurement | Pakistani | Nepalese |
| Minimum | 10.5% | 17.9% |
| Maximum | 100.0% | 73.6% |
| Range | 89.5% | 55.7% |
| Mean | 41.1% | 34.7% |
| Median | 30.5% | 30.1% |
| Interquartile 25% (IQ1) | 25.8% | 26.3% |
| Interquartile 75% (IQ3) | 52.0% | 37.9% |
| Interquartile Range (IQR) | 26.2% | 11.7% |
| Standard Deviation (Sample) | 23.5% | 13.8% |
| Standard Deviation (Population) | 23.3% | 13.6% |
Similar Demographics by Single Mother Poverty
Demographics Similar to Pakistanis by Single Mother Poverty
In terms of single mother poverty, the demographic groups most similar to Pakistanis are Zimbabwean (27.9%, a difference of 0.070%), Immigrants from Croatia (28.0%, a difference of 0.10%), Immigrants from Netherlands (27.9%, a difference of 0.11%), Immigrants from Nepal (27.9%, a difference of 0.12%), and Immigrants from Northern Africa (28.0%, a difference of 0.12%).
| Demographics | Rating | Rank | Single Mother Poverty |
| Albanians | 97.6 /100 | #94 | Exceptional 27.9% |
| Chileans | 97.5 /100 | #95 | Exceptional 27.9% |
| Immigrants | Iraq | 97.3 /100 | #96 | Exceptional 27.9% |
| Immigrants | Brazil | 97.2 /100 | #97 | Exceptional 27.9% |
| Immigrants | Nepal | 97.2 /100 | #98 | Exceptional 27.9% |
| Immigrants | Netherlands | 97.2 /100 | #99 | Exceptional 27.9% |
| Zimbabweans | 97.1 /100 | #100 | Exceptional 27.9% |
| Pakistanis | 96.9 /100 | #101 | Exceptional 28.0% |
| Immigrants | Croatia | 96.7 /100 | #102 | Exceptional 28.0% |
| Immigrants | Northern Africa | 96.6 /100 | #103 | Exceptional 28.0% |
| Italians | 96.6 /100 | #104 | Exceptional 28.0% |
| Israelis | 96.5 /100 | #105 | Exceptional 28.0% |
| Ukrainians | 96.4 /100 | #106 | Exceptional 28.0% |
| Immigrants | Venezuela | 95.8 /100 | #107 | Exceptional 28.1% |
| Immigrants | Zimbabwe | 95.5 /100 | #108 | Exceptional 28.1% |
Demographics Similar to Nepalese by Single Mother Poverty
In terms of single mother poverty, the demographic groups most similar to Nepalese are Immigrants from Eastern Africa (29.3%, a difference of 0.010%), Nigerian (29.3%, a difference of 0.010%), Ghanaian (29.4%, a difference of 0.070%), Canadian (29.3%, a difference of 0.11%), and Yugoslavian (29.4%, a difference of 0.11%).
| Demographics | Rating | Rank | Single Mother Poverty |
| Hawaiians | 47.8 /100 | #176 | Average 29.2% |
| Immigrants | Bosnia and Herzegovina | 45.1 /100 | #177 | Average 29.2% |
| South American Indians | 43.2 /100 | #178 | Average 29.3% |
| Immigrants | Uzbekistan | 42.6 /100 | #179 | Average 29.3% |
| Immigrants | Norway | 41.5 /100 | #180 | Average 29.3% |
| Canadians | 40.4 /100 | #181 | Average 29.3% |
| Immigrants | Eastern Africa | 38.5 /100 | #182 | Fair 29.3% |
| Nepalese | 38.3 /100 | #183 | Fair 29.3% |
| Nigerians | 38.0 /100 | #184 | Fair 29.3% |
| Ghanaians | 36.8 /100 | #185 | Fair 29.4% |
| Yugoslavians | 36.0 /100 | #186 | Fair 29.4% |
| Lebanese | 32.5 /100 | #187 | Fair 29.4% |
| Guamanians/Chamorros | 31.8 /100 | #188 | Fair 29.4% |
| Immigrants | Africa | 31.6 /100 | #189 | Fair 29.4% |
| Immigrants | Germany | 30.4 /100 | #190 | Fair 29.5% |