Paiute vs Norwegian Child Poverty Under the Age of 5
COMPARE
Paiute
Norwegian
Child Poverty Under the Age of 5
Child Poverty Under the Age of 5 Comparison
Paiute
Norwegians
23.8%
CHILD POVERTY UNDER THE AGE OF 5
0.0/ 100
METRIC RATING
324th/ 347
METRIC RANK
14.6%
CHILD POVERTY UNDER THE AGE OF 5
99.7/ 100
METRIC RATING
39th/ 347
METRIC RANK
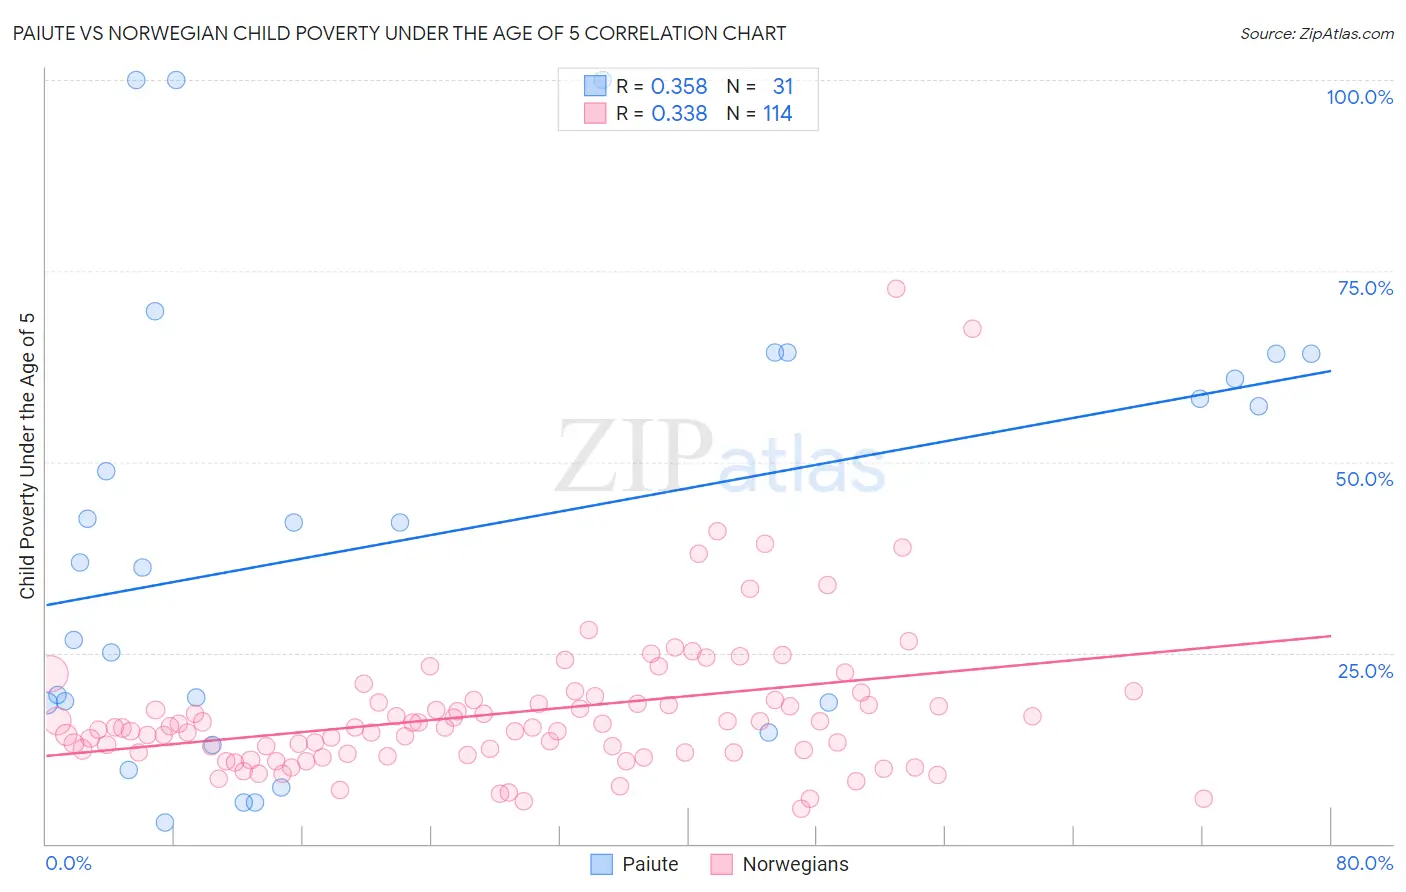
Paiute vs Norwegian Child Poverty Under the Age of 5 Correlation Chart
The statistical analysis conducted on geographies consisting of 58,012,157 people shows a mild positive correlation between the proportion of Paiute and poverty level among children under the age of 5 in the United States with a correlation coefficient (R) of 0.358 and weighted average of 23.8%. Similarly, the statistical analysis conducted on geographies consisting of 498,503,242 people shows a mild positive correlation between the proportion of Norwegians and poverty level among children under the age of 5 in the United States with a correlation coefficient (R) of 0.338 and weighted average of 14.6%, a difference of 63.2%.
Child Poverty Under the Age of 5 Correlation Summary
| Measurement | Paiute | Norwegian |
| Minimum | 2.7% | 4.5% |
| Maximum | 100.0% | 72.7% |
| Range | 97.3% | 68.2% |
| Mean | 40.5% | 17.2% |
| Median | 36.7% | 15.2% |
| Interquartile 25% (IQ1) | 18.4% | 11.9% |
| Interquartile 75% (IQ3) | 64.1% | 18.5% |
| Interquartile Range (IQR) | 45.7% | 6.6% |
| Standard Deviation (Sample) | 28.9% | 10.0% |
| Standard Deviation (Population) | 28.4% | 10.0% |
Similar Demographics by Child Poverty Under the Age of 5
Demographics Similar to Paiute by Child Poverty Under the Age of 5
In terms of child poverty under the age of 5, the demographic groups most similar to Paiute are Immigrants from Congo (23.9%, a difference of 0.21%), Central American Indian (23.9%, a difference of 0.39%), Pueblo (23.7%, a difference of 0.61%), Dominican (24.0%, a difference of 0.85%), and Immigrants from Dominican Republic (24.1%, a difference of 0.94%).
| Demographics | Rating | Rank | Child Poverty Under the Age of 5 |
| Menominee | 0.0 /100 | #317 | Tragic 23.3% |
| Dutch West Indians | 0.0 /100 | #318 | Tragic 23.3% |
| Chippewa | 0.0 /100 | #319 | Tragic 23.4% |
| Choctaw | 0.0 /100 | #320 | Tragic 23.5% |
| Immigrants | Honduras | 0.0 /100 | #321 | Tragic 23.5% |
| Ute | 0.0 /100 | #322 | Tragic 23.5% |
| Pueblo | 0.0 /100 | #323 | Tragic 23.7% |
| Paiute | 0.0 /100 | #324 | Tragic 23.8% |
| Immigrants | Congo | 0.0 /100 | #325 | Tragic 23.9% |
| Central American Indians | 0.0 /100 | #326 | Tragic 23.9% |
| Dominicans | 0.0 /100 | #327 | Tragic 24.0% |
| Immigrants | Dominican Republic | 0.0 /100 | #328 | Tragic 24.1% |
| Cajuns | 0.0 /100 | #329 | Tragic 24.1% |
| Creek | 0.0 /100 | #330 | Tragic 24.2% |
| Kiowa | 0.0 /100 | #331 | Tragic 24.5% |
Demographics Similar to Norwegians by Child Poverty Under the Age of 5
In terms of child poverty under the age of 5, the demographic groups most similar to Norwegians are Eastern European (14.6%, a difference of 0.0%), Turkish (14.6%, a difference of 0.27%), Immigrants from Australia (14.6%, a difference of 0.29%), Immigrants from Belarus (14.7%, a difference of 0.41%), and Soviet Union (14.7%, a difference of 0.57%).
| Demographics | Rating | Rank | Child Poverty Under the Age of 5 |
| Immigrants | Sri Lanka | 99.8 /100 | #32 | Exceptional 14.4% |
| Taiwanese | 99.8 /100 | #33 | Exceptional 14.5% |
| Immigrants | Moldova | 99.8 /100 | #34 | Exceptional 14.5% |
| Latvians | 99.8 /100 | #35 | Exceptional 14.5% |
| Maltese | 99.8 /100 | #36 | Exceptional 14.5% |
| Turks | 99.7 /100 | #37 | Exceptional 14.6% |
| Eastern Europeans | 99.7 /100 | #38 | Exceptional 14.6% |
| Norwegians | 99.7 /100 | #39 | Exceptional 14.6% |
| Immigrants | Australia | 99.7 /100 | #40 | Exceptional 14.6% |
| Immigrants | Belarus | 99.7 /100 | #41 | Exceptional 14.7% |
| Soviet Union | 99.7 /100 | #42 | Exceptional 14.7% |
| Immigrants | Greece | 99.7 /100 | #43 | Exceptional 14.7% |
| Immigrants | Philippines | 99.7 /100 | #44 | Exceptional 14.7% |
| Laotians | 99.6 /100 | #45 | Exceptional 14.7% |
| Tsimshian | 99.6 /100 | #46 | Exceptional 14.7% |