Immigrants from Brazil vs Immigrants from Middle Africa Female Poverty Among 25-34 Year Olds
COMPARE
Immigrants from Brazil
Immigrants from Middle Africa
Female Poverty Among 25-34 Year Olds
Female Poverty Among 25-34 Year Olds Comparison
Immigrants from Brazil
Immigrants from Middle Africa
12.8%
FEMALE POVERTY AMONG 25-34 YEAR OLDS
93.3/ 100
METRIC RATING
115th/ 347
METRIC RANK
14.8%
FEMALE POVERTY AMONG 25-34 YEAR OLDS
1.0/ 100
METRIC RATING
245th/ 347
METRIC RANK
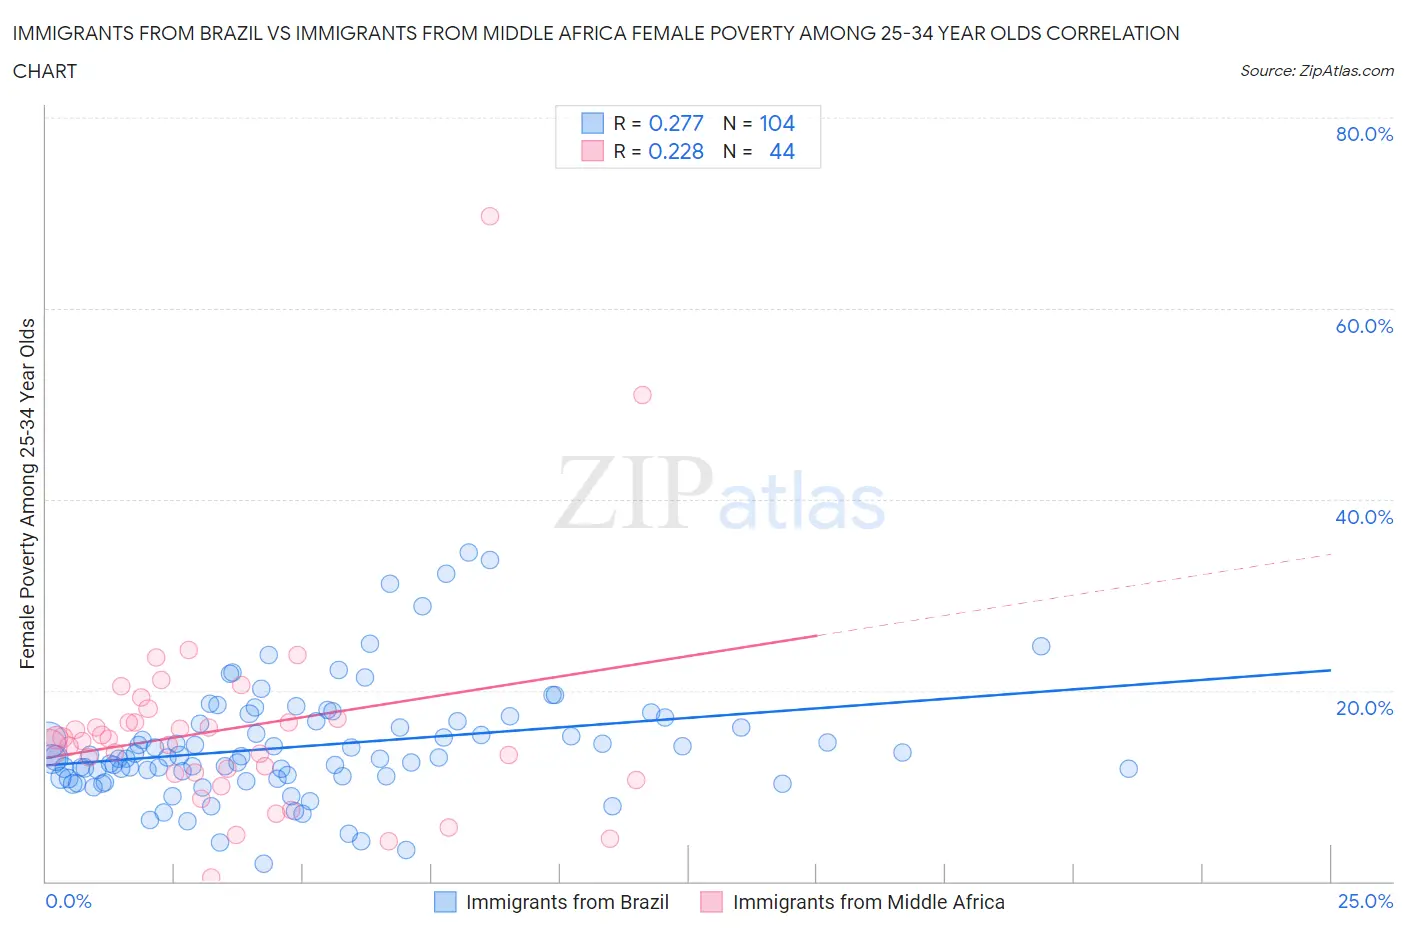
Immigrants from Brazil vs Immigrants from Middle Africa Female Poverty Among 25-34 Year Olds Correlation Chart
The statistical analysis conducted on geographies consisting of 338,129,930 people shows a weak positive correlation between the proportion of Immigrants from Brazil and poverty level among females between the ages 25 and 34 in the United States with a correlation coefficient (R) of 0.277 and weighted average of 12.8%. Similarly, the statistical analysis conducted on geographies consisting of 201,471,968 people shows a weak positive correlation between the proportion of Immigrants from Middle Africa and poverty level among females between the ages 25 and 34 in the United States with a correlation coefficient (R) of 0.228 and weighted average of 14.8%, a difference of 15.8%.
Female Poverty Among 25-34 Year Olds Correlation Summary
| Measurement | Immigrants from Brazil | Immigrants from Middle Africa |
| Minimum | 1.9% | 0.42% |
| Maximum | 34.5% | 69.6% |
| Range | 32.6% | 69.2% |
| Mean | 14.2% | 16.0% |
| Median | 12.9% | 14.8% |
| Interquartile 25% (IQ1) | 10.9% | 11.4% |
| Interquartile 75% (IQ3) | 16.7% | 16.8% |
| Interquartile Range (IQR) | 5.9% | 5.5% |
| Standard Deviation (Sample) | 6.0% | 11.3% |
| Standard Deviation (Population) | 6.0% | 11.2% |
Similar Demographics by Female Poverty Among 25-34 Year Olds
Demographics Similar to Immigrants from Brazil by Female Poverty Among 25-34 Year Olds
In terms of female poverty among 25-34 year olds, the demographic groups most similar to Immigrants from Brazil are Chilean (12.8%, a difference of 0.030%), Immigrants from Southern Europe (12.8%, a difference of 0.090%), Immigrants from Kuwait (12.8%, a difference of 0.090%), Mongolian (12.8%, a difference of 0.10%), and Immigrants from Nepal (12.8%, a difference of 0.11%).
| Demographics | Rating | Rank | Female Poverty Among 25-34 Year Olds |
| Immigrants | Norway | 94.4 /100 | #108 | Exceptional 12.7% |
| Immigrants | Peru | 94.3 /100 | #109 | Exceptional 12.7% |
| Australians | 94.1 /100 | #110 | Exceptional 12.8% |
| Danes | 93.9 /100 | #111 | Exceptional 12.8% |
| Immigrants | Morocco | 93.9 /100 | #112 | Exceptional 12.8% |
| Immigrants | Syria | 93.8 /100 | #113 | Exceptional 12.8% |
| Immigrants | Southern Europe | 93.6 /100 | #114 | Exceptional 12.8% |
| Immigrants | Brazil | 93.3 /100 | #115 | Exceptional 12.8% |
| Chileans | 93.2 /100 | #116 | Exceptional 12.8% |
| Immigrants | Kuwait | 93.1 /100 | #117 | Exceptional 12.8% |
| Mongolians | 93.0 /100 | #118 | Exceptional 12.8% |
| Immigrants | Nepal | 93.0 /100 | #119 | Exceptional 12.8% |
| Carpatho Rusyns | 93.0 /100 | #120 | Exceptional 12.8% |
| Romanians | 92.8 /100 | #121 | Exceptional 12.8% |
| Immigrants | Western Asia | 92.7 /100 | #122 | Exceptional 12.8% |
Demographics Similar to Immigrants from Middle Africa by Female Poverty Among 25-34 Year Olds
In terms of female poverty among 25-34 year olds, the demographic groups most similar to Immigrants from Middle Africa are Jamaican (14.8%, a difference of 0.040%), Immigrants from Bangladesh (14.8%, a difference of 0.18%), Immigrants from Nicaragua (14.8%, a difference of 0.19%), Scotch-Irish (14.8%, a difference of 0.22%), and Barbadian (14.8%, a difference of 0.22%).
| Demographics | Rating | Rank | Female Poverty Among 25-34 Year Olds |
| Alsatians | 1.4 /100 | #238 | Tragic 14.7% |
| Malaysians | 1.4 /100 | #239 | Tragic 14.7% |
| Immigrants | Grenada | 1.3 /100 | #240 | Tragic 14.7% |
| Scotch-Irish | 1.2 /100 | #241 | Tragic 14.8% |
| Barbadians | 1.2 /100 | #242 | Tragic 14.8% |
| Immigrants | Nicaragua | 1.1 /100 | #243 | Tragic 14.8% |
| Immigrants | Bangladesh | 1.1 /100 | #244 | Tragic 14.8% |
| Immigrants | Middle Africa | 1.0 /100 | #245 | Tragic 14.8% |
| Jamaicans | 1.0 /100 | #246 | Tragic 14.8% |
| German Russians | 0.8 /100 | #247 | Tragic 14.9% |
| Immigrants | Western Africa | 0.8 /100 | #248 | Tragic 14.9% |
| Immigrants | Haiti | 0.5 /100 | #249 | Tragic 15.0% |
| Immigrants | El Salvador | 0.5 /100 | #250 | Tragic 15.0% |
| Haitians | 0.5 /100 | #251 | Tragic 15.0% |
| Belizeans | 0.4 /100 | #252 | Tragic 15.1% |